After a slight recovery from the $18.7K mark over the last few days ago, Bitcoin’s price is now slowly drifting around the 2017 ATH level. The cryptocurrency market, however, has not demonstrated any evidence of strength or reversal patterns.
Техникалык анализ
By Шаян
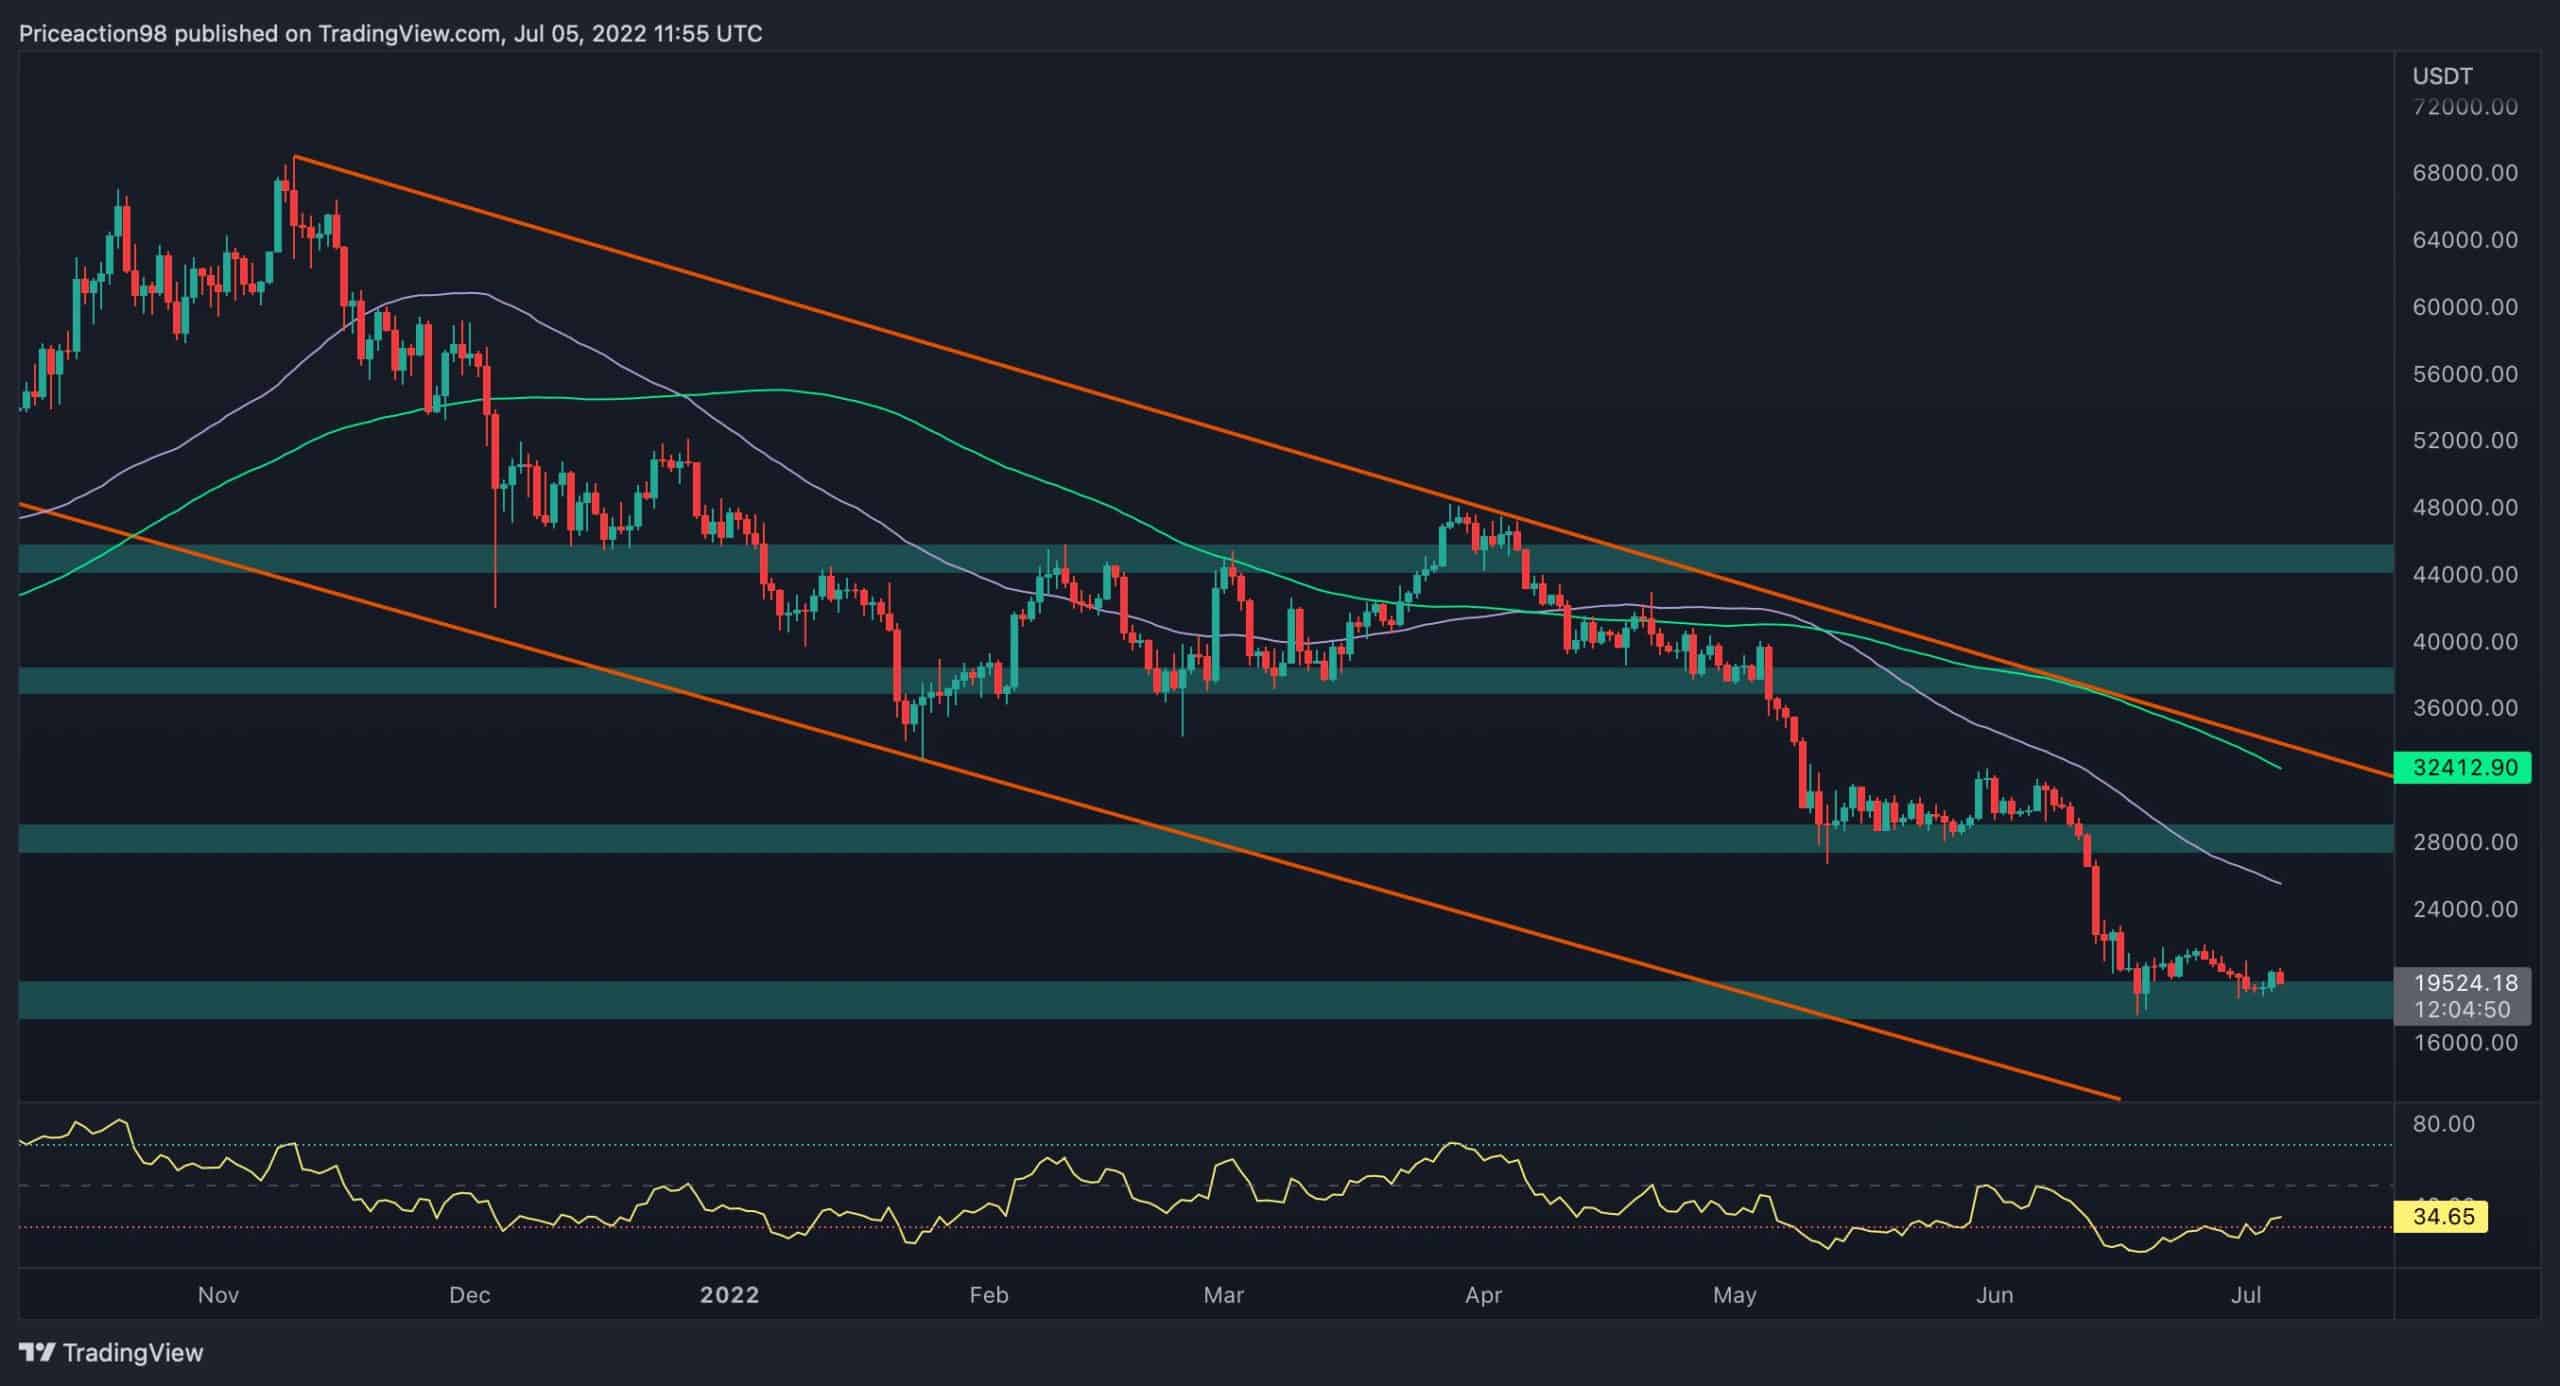
Daily Chart
As seen in the following chart, the price has been forming lower lows and lower highs, which indicates strong bearish momentum. Accordingly, BTC hasn’t yet been able to form a new higher high in the daily timeframe. Therefore, a bullish rally cannot be anticipated until it develops a reversal pattern and records a new significant higher high above the $32K key level.
On the other hand, a prolonged ranging phase or consolidation can ultimately result in another bearish move to the critical $16.6K level.
4 сааттык диаграмма
Over the past few weeks, the $18K level has significantly supported the Bitcoin price. Additionally, the lower boundary of the shown triangle has also supported the price, pushing to break the channel’s middle trendline.
The price has been rejected after exceeding the mid-trendline of the channel and failing to test the triangle’s upper trendline. However, the most recent shakeout may be a pullback to the broken boundary. If Bitcoin successfully forms the pullback, a surge followed by the triangle breakout will be more likely.
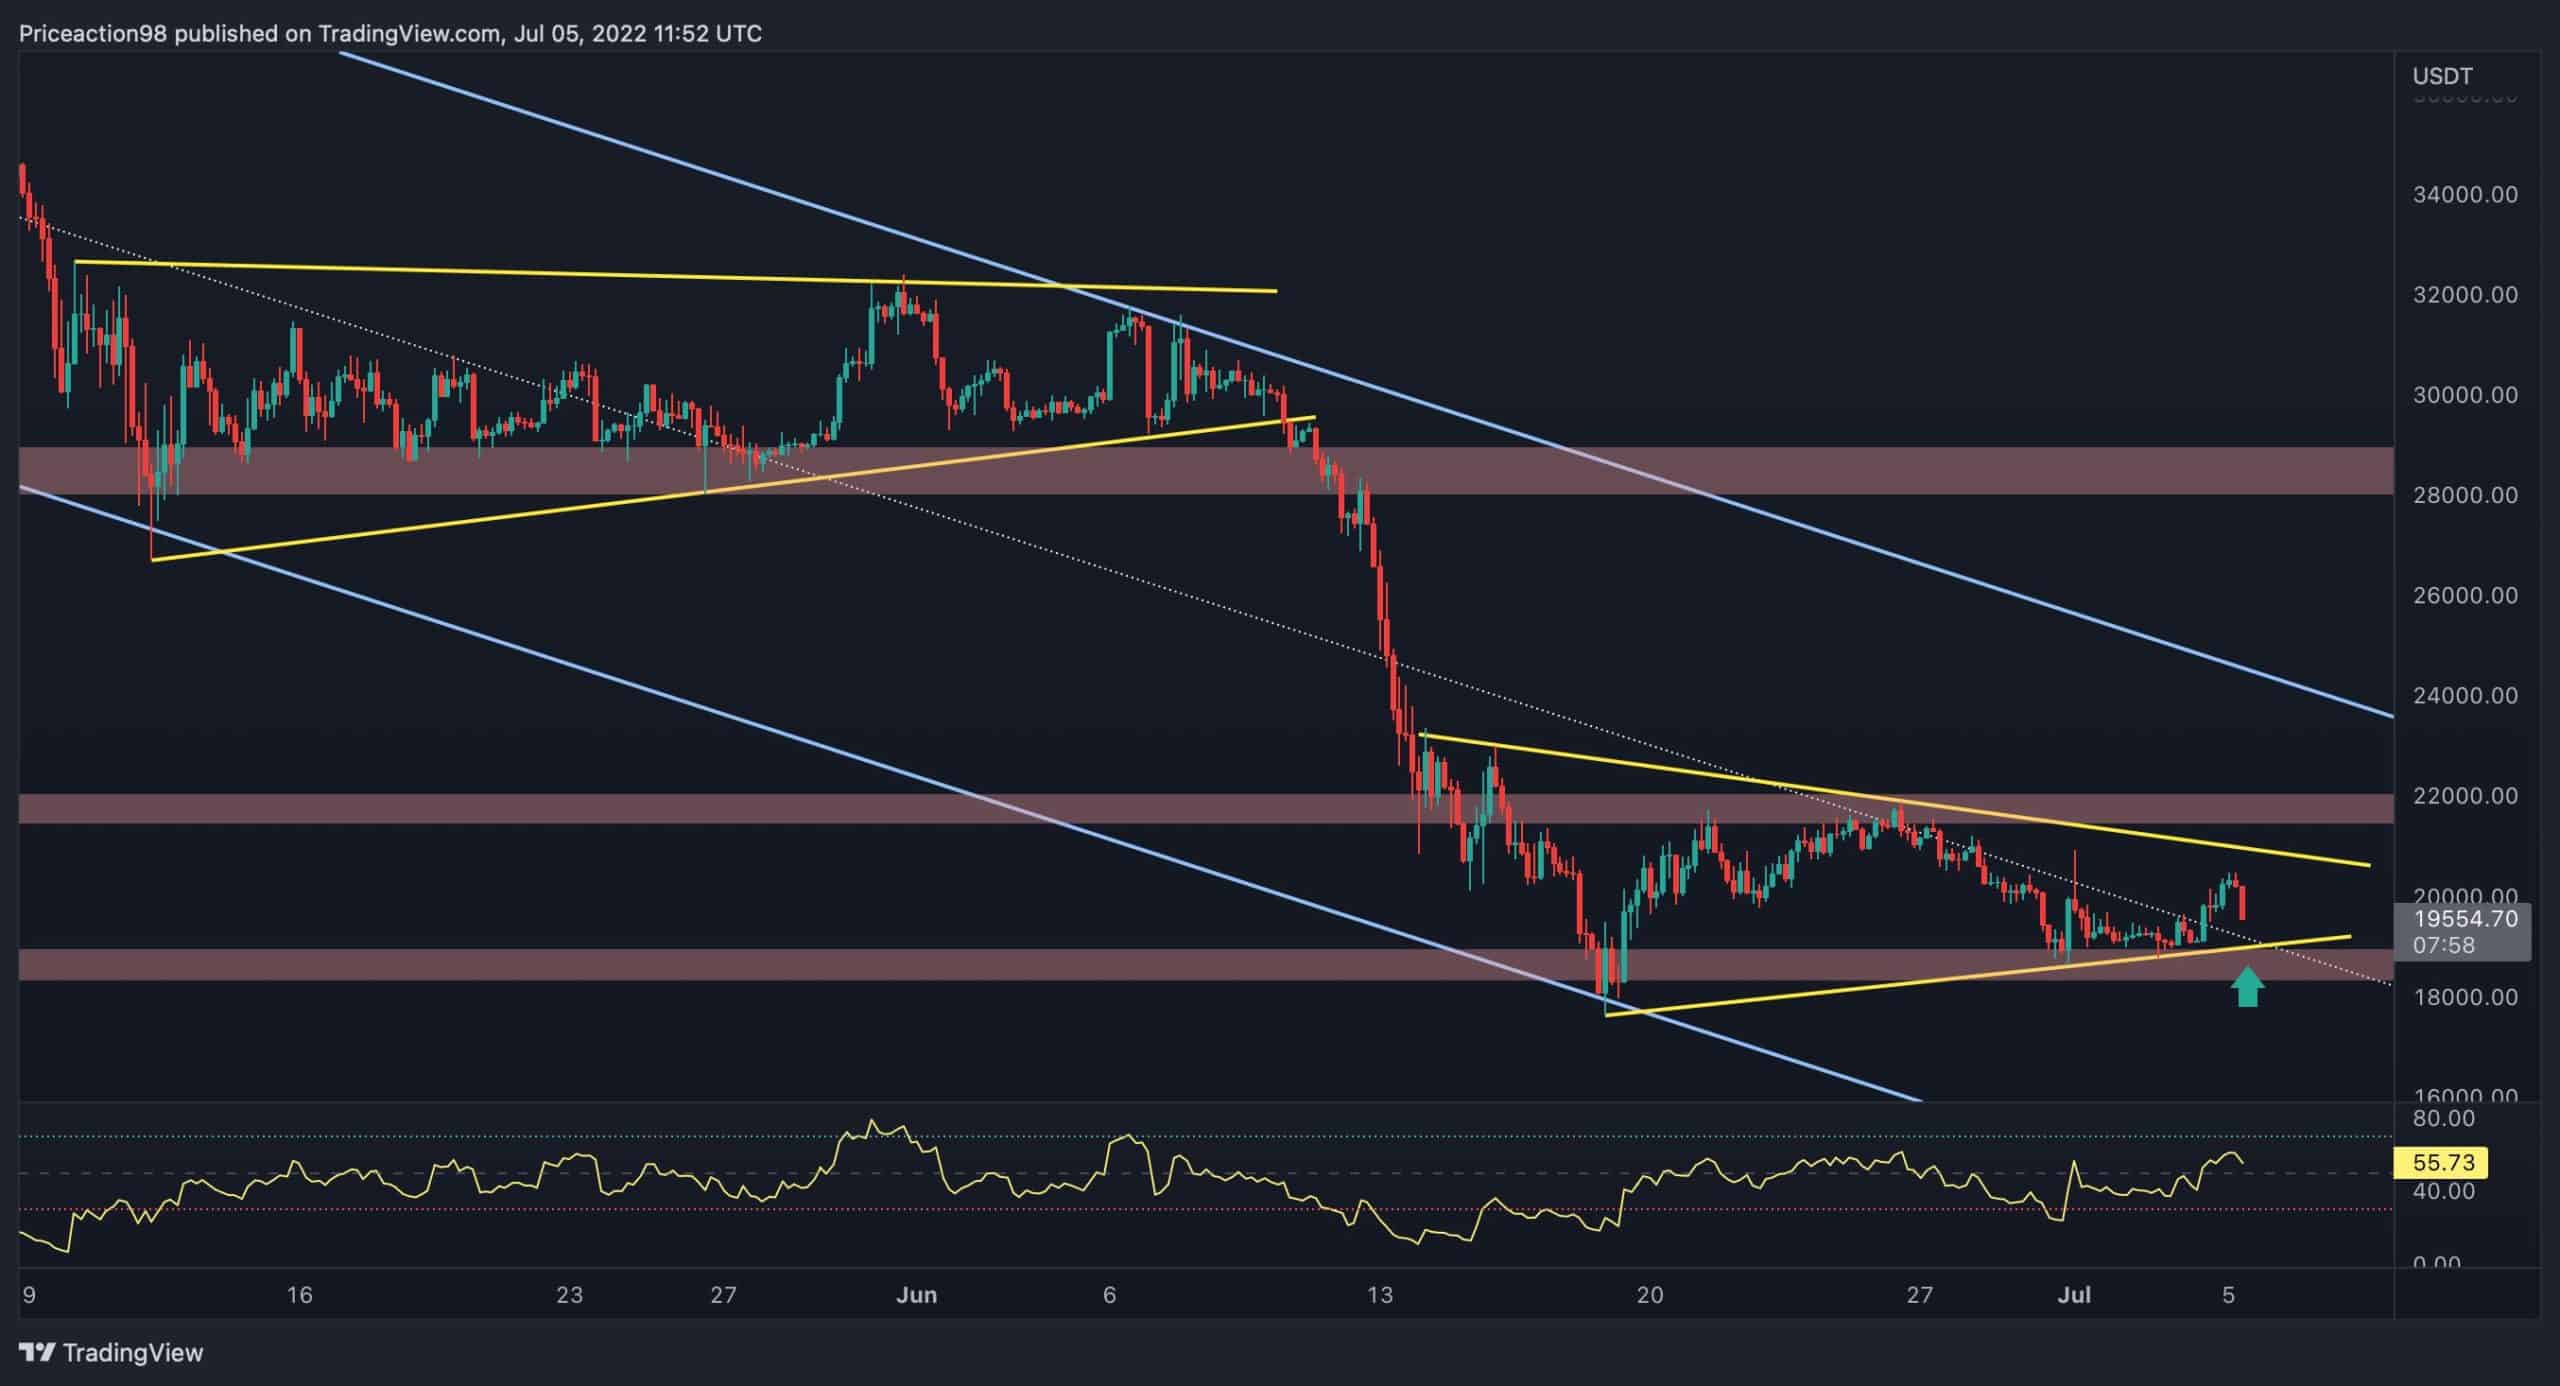
However, if the triangle pattern and the $18K significant support level fail to hold the price, this would make a decline much more probable. In this scenario, the triangular pattern is a continuation correction pattern for the leading bearish leg.
Сезим анализи
менен: Эдрис
Bitcoin Taker Buy Sell Ratio (SMA 50)
Thanks to the growing share of the Futures Market against the Spot Market, Bitcoin’s price has been determined mainly by this sector over the last 18 months. One of the critical indicators to evaluate the Futures market sentiment is the Taker Buy Sell ratio which, in short, indicates whether the bulls or the bears are more aggressive and in control.
As demonstrated on the chart, values below 1 indicate more selling pressure and likely coincide with bearish price action. Conversely, values above one tend to lead to bullish price action. It is evident that this metric has broken above one, and the price seems to be consolidating and potentially starting a bullish trend in the short term.
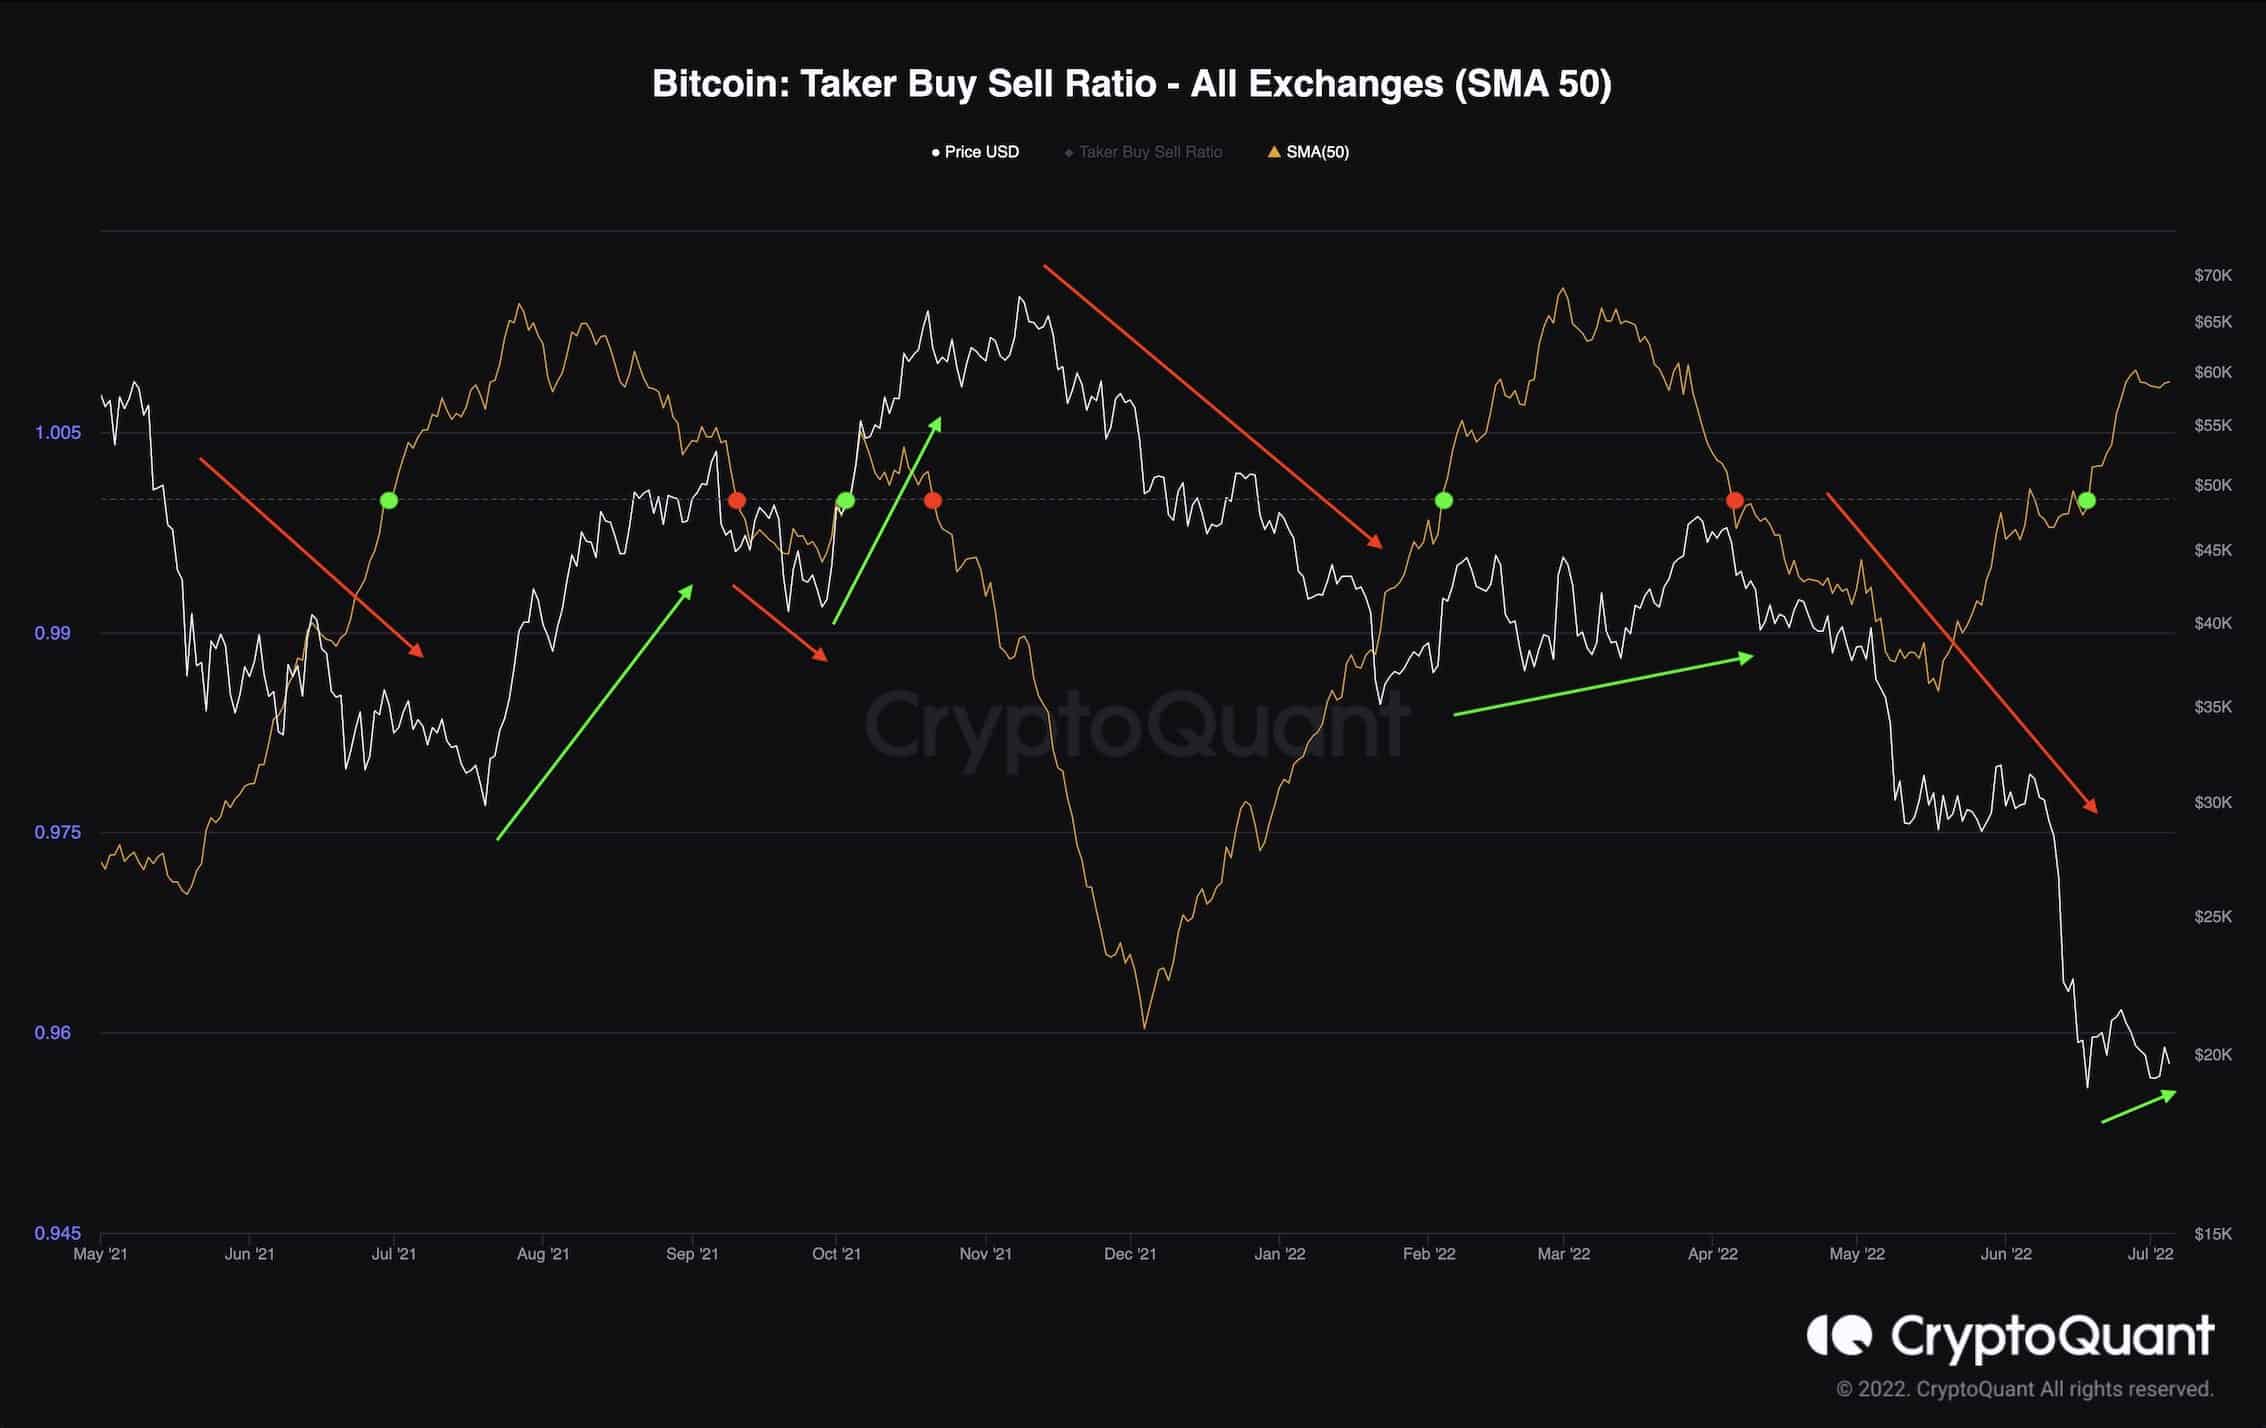
However, note that it could be a consolidation or a bullish pullback before another continuation lower. So, many other factors should be considered closely in the coming weeks to determine if a bullish reversal or another bull trap could be expected.
Binance Акысыз $100 (Эксклюзив): бул шилтемени колдонуу Каттоо жана биринчи айда Binance Futures боюнча $100 бекер жана 10% арзандатуу жыйымдарын алуу (шарттары).
PrimeXBT атайын сунушу: бул шилтемени колдонуу каттоодон өтүңүз жана депозиттериңиз боюнча 50 долларга чейин алуу үчүн POTATO7,000 кодун киргизиңиз.
Disclaimer: маалыматтар келтирилген жазуучулар ошол CryptoPotato бар табылган. Бул CryptoPotato сатып, сатуу, же кандайдыр бир салымдарды өткөрөбү же жокпу деген пикирин билдирбейт. Сиз салым чечим болбосун чыгарарда өз изилдөөлөрдү жүргүзүү сунушталат. Өз тобокелге камсыз кылган маалыматты колдонобуз. Көбүрөөк маалымат алуу үчүн тартууну карагыла.
Cryptocurrency схемалар менен TradingView.
Source: https://cryptopotato.com/bitcoin-price-analysis-btc-testing-20k-but-is-another-pullback-coming/