- According to recent research, the APT market is upbeat.
- Indicators suggest that the APT price surge may come to an end.
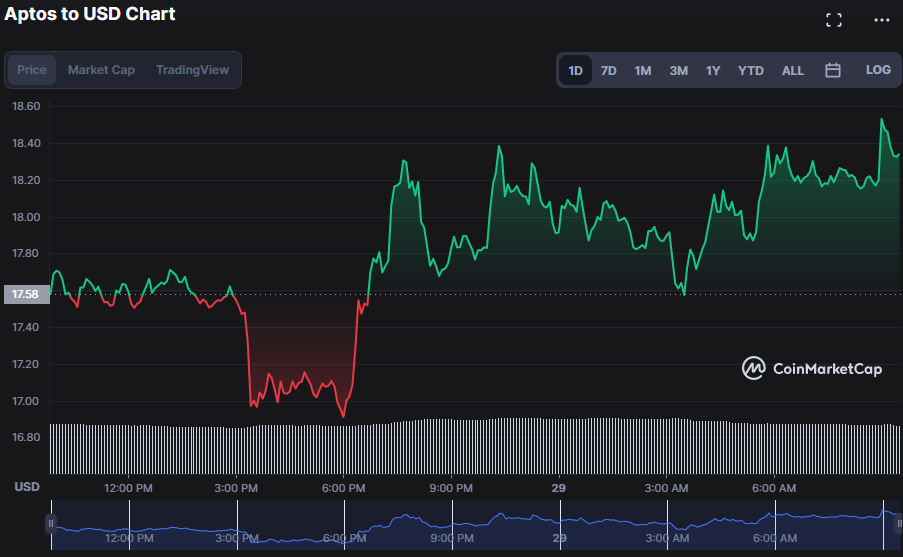
- Bullish dominance prevails in the Aptos market after establishing support at $16.90.
After an early-morning back-and-forth between bulls and bears in the Aptos (APT) market, bulls ultimately prevailed, driving prices up to an intraday high of $18.53 after finding support around $16.90. This bullish run continued until press time, valuing the APT price at $18.14, a 3.46% increase.
The APT market capitalization grew by 3.64% to $2,922,609,502, due to the bullish dominance; nevertheless, the 24-hour trading volume dipped by 3.83% to $1,170,725,386. Due to a drop in 24-hour trading volume and a flagging bull run, investors would be wise to tread carefully for the time being.
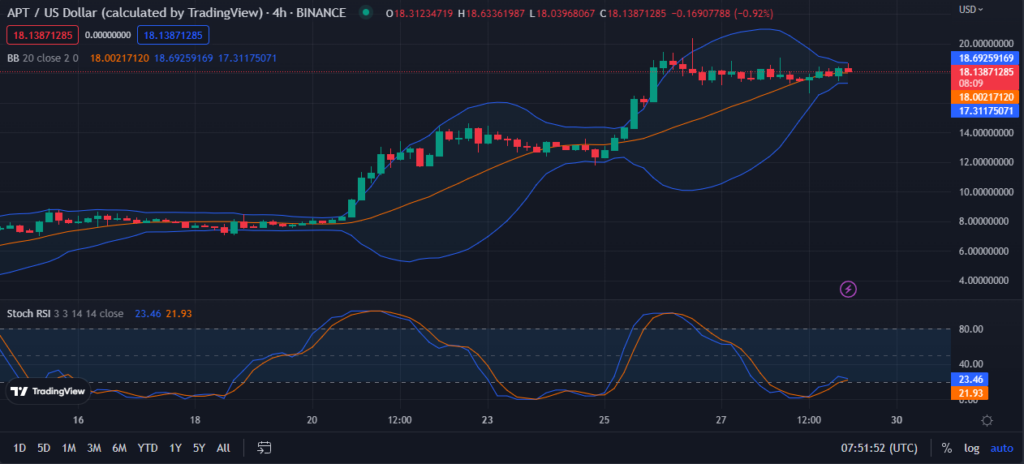
The linear movement of the Bollinger Bands, which presently lies between the upper and lower bands at $18.69379324 and $17.31183670, indicates that the APT market is stabilizing. This relatively flat trend suggests that the market may not see any significant price fluctuations in the foreseeable future, as traders and investors alike have grown more confident with present pricing.

Given that the stochastic RSI for APT’s 4-hour price chart is currently at 25.39, it appears that bullish momentum in the market is waning and that bears may soon have an opportunity to regain control of the market. The market may enter a period of negative trading as a result of the bears’ expected increase in aggression. This might be bolstered further by the decreased amount of trading activity, which suggests a lack of excitement among traders to take on long positions.
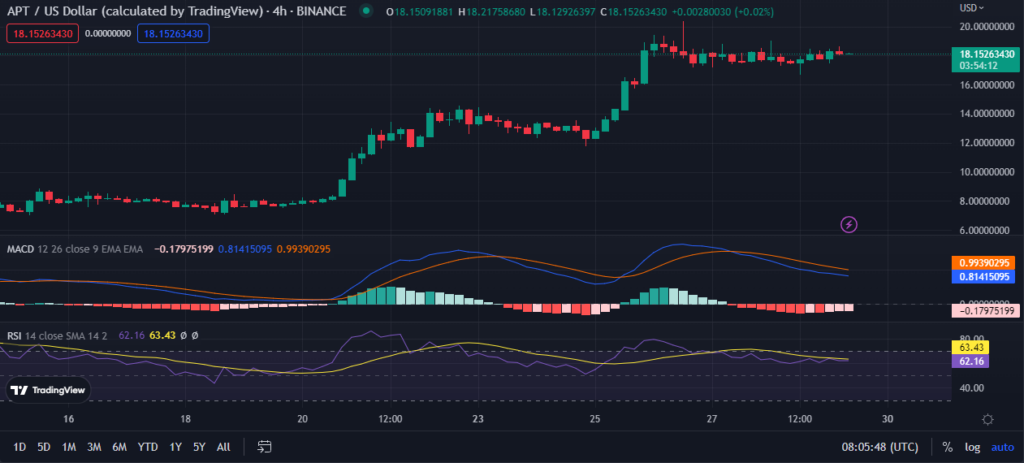
The MACD line’s recent dip (0.85140209) below its SMA line supports this bearish forecast. When the MACD line is below its SMA line, it implies that selling pressure is high and that the bears are likely to control the APT market till the MACD line crosses back above its SMA line.
Additionally, the 62.61 value for the Relative Strength Index (RSI) on the APT баасы chart reveals that the RSI has dropped below the signal line, signaling that the price of APT is about to collapse. This shift in the RSI is indicative of a possible reversal in the near future, as the uptrend is losing momentum.
Bulls must propel prices higher and maintain the present resistance level in order to wipe out the unfavorable signs on the Aptos market.
баш тартуу: Көз караштар жана пикирлер, ошондой эле бул баа талдоо бөлүшүлгөн бардык маалыматтар, ак ниеттүүлүк менен жарыяланган. Окурмандар өз алдынча изилдөө жана тийиштүү дыкат жасашы керек. Окурман тарабынан кабыл алынган ар кандай иш-аракеттер толугу менен өздөрүнүн тобокелдигинде. Coin Edition жана анын филиалдары түз же кыйыр зыян же жоготуу үчүн жоопкерчилик тартпайт.
Source: https://coinedition.com/price-indicators-point-to-a-reversal-casting-doubt-on-apt-bullishness/