The Hedera (HBAR) price has cleared a long, and short-term diagonal resistance line. It increased sharply on August 14.
The price action and indicator readings from multiple timeframes show a bullish trend, supporting the continuing increase.
Has Hedera Begun a Long-Term Reversal?
The HBAR price broke out from a 511-day resistance line at the beginning of February. The line had previously been in place since the all-time high of $0.584 in September 2021.
The price boost can likely be attributed to a recent move by the US Federal Reserve to incorporate Dropp into FedNow, leveraging Hedera’s technology for faster micropayments.
Breakouts from such long-term structures indicate that the previous correction is complete and a new movement has begun in the other direction.
However, HBAR failed to sustain its increase. On the contrary, it was rejected by the $0.090 horizontal resistance area (red icon) the week of the breakdown. It then fell to a low of $0.040 in June, validating the line as support (green icon).
The price began an upward movement afterward and has increased since. HBAR now trades above the $0.050 horizontal area, which is expected to act as support.
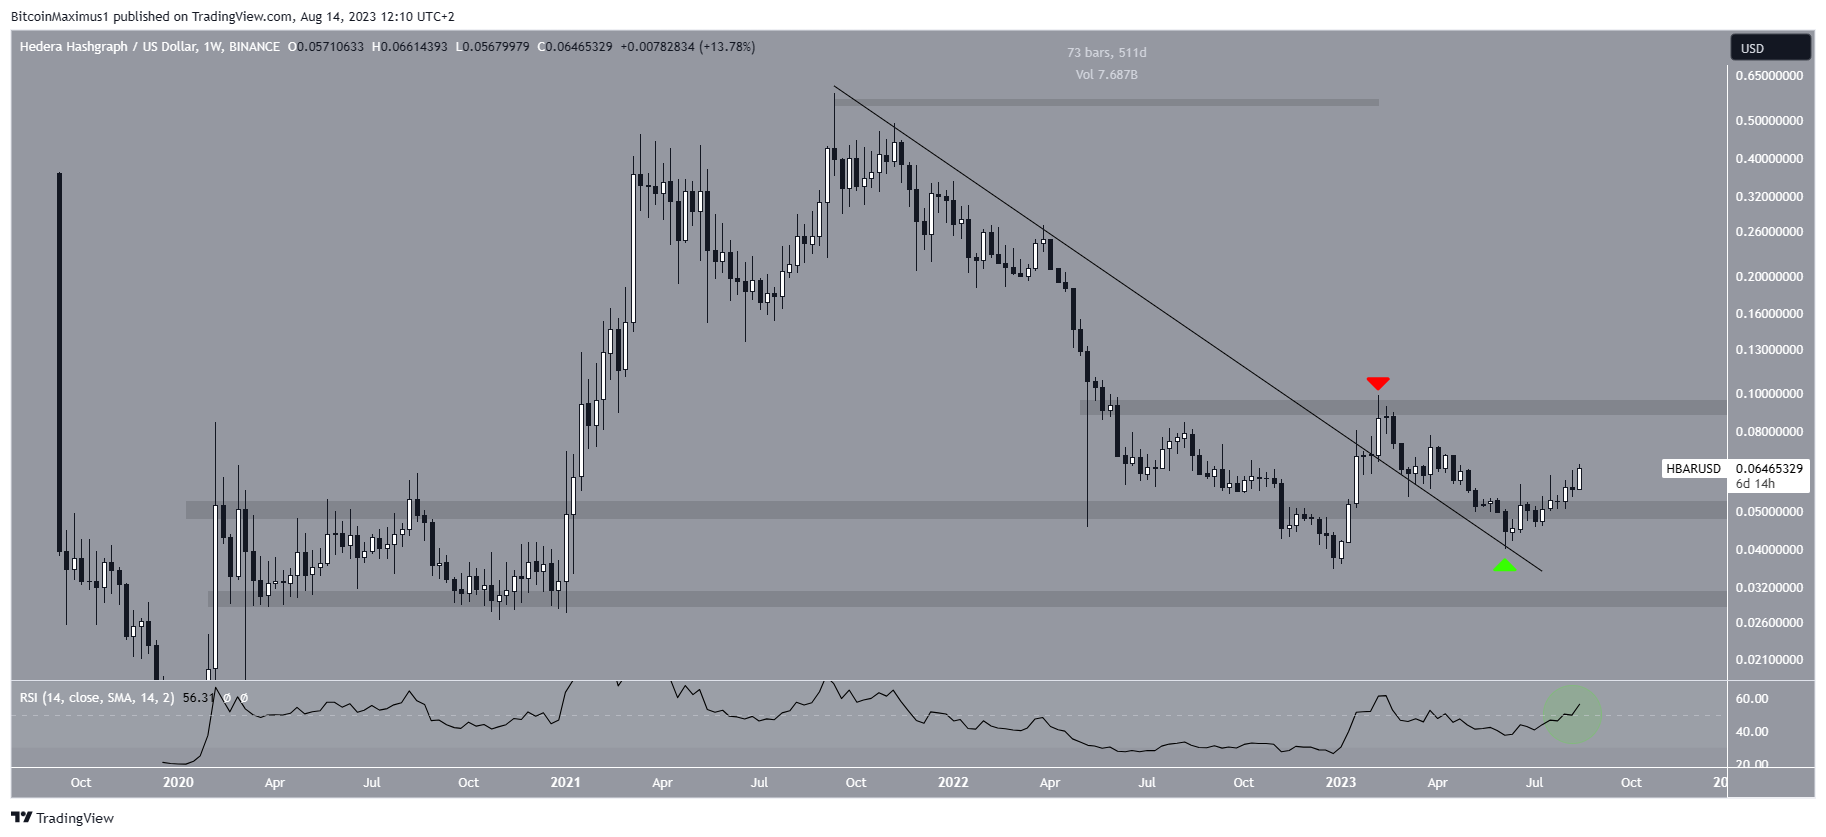
The weekly RSI supports the continuation of the increase. The RSI is a momentum indicator used by traders to evaluate whether a market is overbought or oversold and to determine whether to accumulate or sell an asset.
Readings above 50 and an upward trend suggest that bulls still have an advantage, while readings below 50 indicate the opposite. The indicator is increasing and above 50 (green circle), both signs of a bullish trend. This suggests that the increase will continue to the next resistance at $0.090.
HBAR Price Prediction: Rate of Increase Can Accelerate Soon
The technical analysis from the daily timeframe aligns with the bullish one from the weekly timeframe. There are two main reasons for this.
Firstly, the HBAR price broke out from a shorter-term descending resistance line on June 20. Secondly, the price moved above the $0.057 horizontal resistance area and then validated it as support. The daily RSI is also above 50 and increasing, showing a bullish trend.
While there is a minor resistance at $0.074, these bullish signs indicate that the HBAR price will likely break out above it and reach the $0.090 resistance area. This would be an increase of 40%, measuring from the current price.
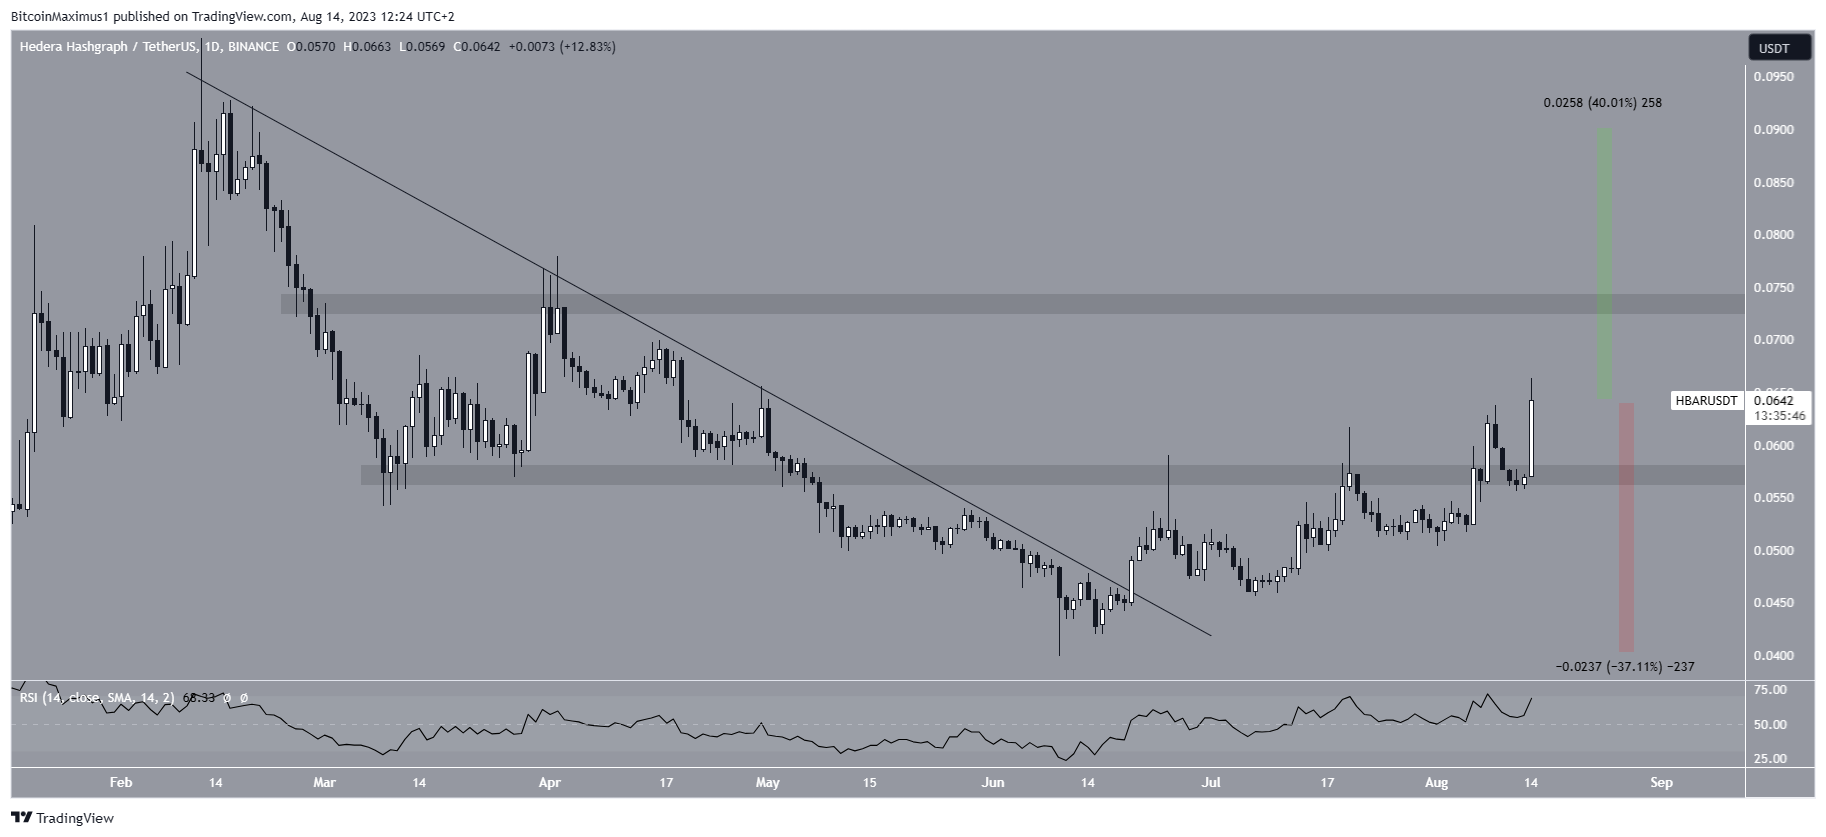
Despite this bullish HBAR price prediction, a close below $0.057 will invalidate the ongoing upward movement.
In that case, the price can fall to the June lows at $0.040, a decrease of 37% measuring from the current price.
BeInCrypto крипто рыногунун акыркы анализи үчүн бул жерди басыңыз.
баш тартуу
Ишенимдүү Долбоордун көрсөтмөлөрүнө ылайык, бул баа талдоо макаласы маалыматтык максатта гана берилген жана финансылык же инвестициялык кеңеш катары каралбашы керек. BeInCrypto так, калыс отчет берүүгө умтулат, бирок рынок шарттары эскертүүсүз өзгөрүшү мүмкүн. Ар дайым өзүңүздүн изилдөөңүздү жүргүзүп, финансылык чечимдерди кабыл алуудан мурун адис менен кеңешиңиз.
Source: https://beincrypto.com/hedera-price-breakout-fed-integration/