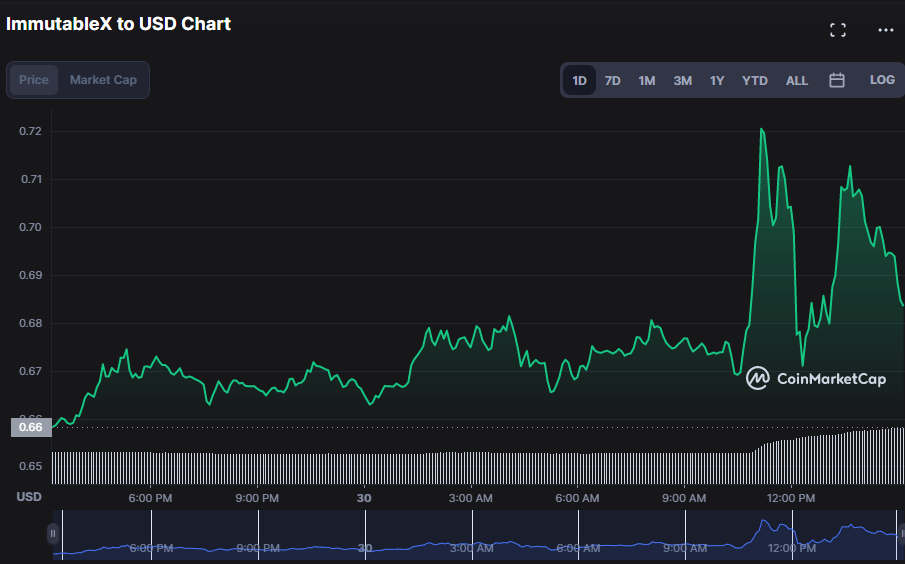
- Bullish dominance prevails in the ImmutableX market after finding support around $0.66.
- According to the current analysis, the ImmutableX market is bullish.
- Indicators show that the market is overbought, hence traders ought to be cautious.
The ImmutableX (IMX) market has been dominated by bulls in the last 24 hours, with the price moving in a narrow range between $0.6547 and $0.7207. At the time of writing, this bullish trend was still in full force, causing the IMX price to rise by 5.74% to $0.694.
The IMX market capitalization increased to $549,013,192 with a 24-hour trading volume of $38,335,863 as a result of the market’s increased interest and positive dominance. These numbers point to a bullish market bias, suggesting that IMX will be rising in the near future.
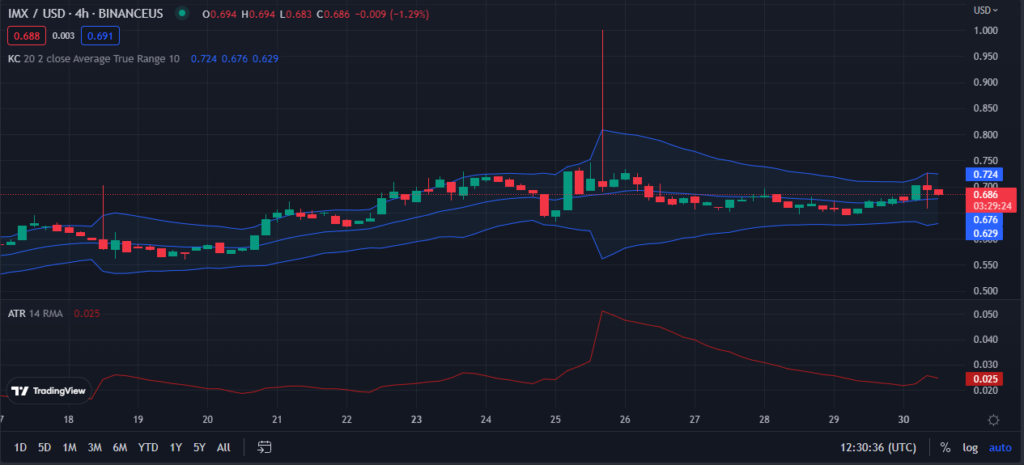
The Keltner Channel bands are bulging, with the top band at $0.724 and the lower band at $0.676, suggesting that the IMX price is likely to climb further. A buy signal is generated when the price moves toward the upper band; while a sell signal is generated when the price moves below the lower band. On the IMX price chart, a buy signal is generated since the price is going toward the upper band. This move bolsters traders’ optimism for a protracted bull run in the near term.
As the IMX market’s average true range readings gradually decline, a negative trend is expected to emerge and pull the market down. The ATR’s reading of 0.025 indicates that the bulls are still in charge of the IMX market; however, since it is heading south, the trend is likely to shift to the bears in the short term.
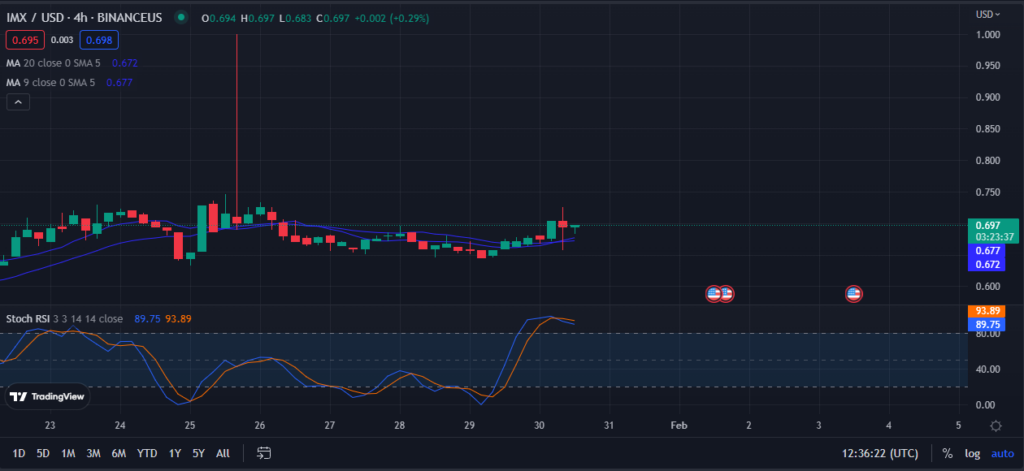
On the IMX price chart, a golden cross (bullish crossover) is shown when the 9-day MA crosses over the 20-day MA. This is reinforced by 4-hour price chart readings of 0.676 and 0.672, respectively. As the price rises above both MAs, generating a green candlestick, the bullish sentiment becomes stronger, signaling that the market attitude will stay positive.
At 89.75, the stochastic RSI falls below the signal line, which means that an uptrend may be overbought and due for a correction. Given the trend’s direction, traders should keep an eye out for a possible reversal in the near future, as this development could signal waning bull power.
Technical indicators show that the bulls have the upper hand in the IMX market, predicting that prices may rise higher.
баш тартуу: Көз караштар жана пикирлер, ошондой эле бул баа талдоо бөлүшүлгөн бардык маалыматтар, ак ниеттүүлүк менен жарыяланган. Окурмандар өз алдынча изилдөө жана тийиштүү дыкат жасашы керек. Окурман тарабынан кабыл алынган ар кандай иш-аракеттер толугу менен өздөрүнүн тобокелдигинде. Coin Edition жана анын филиалдары түз же кыйыр зыян же жоготуу үчүн жоопкерчилик тартпайт.
Source: https://coinedition.com/bullish-supremacy-anticipated-in-imx-market-builds-hope-for-gains/