Following the recent recovery of Bitcoin, Ethereum’s price seems to be following suit and is now showing strength after months of bearish price action. The market is breaking above key levels one by one. Is the momentum going to continue?
Техникалык анализ
тарабынан: Edris
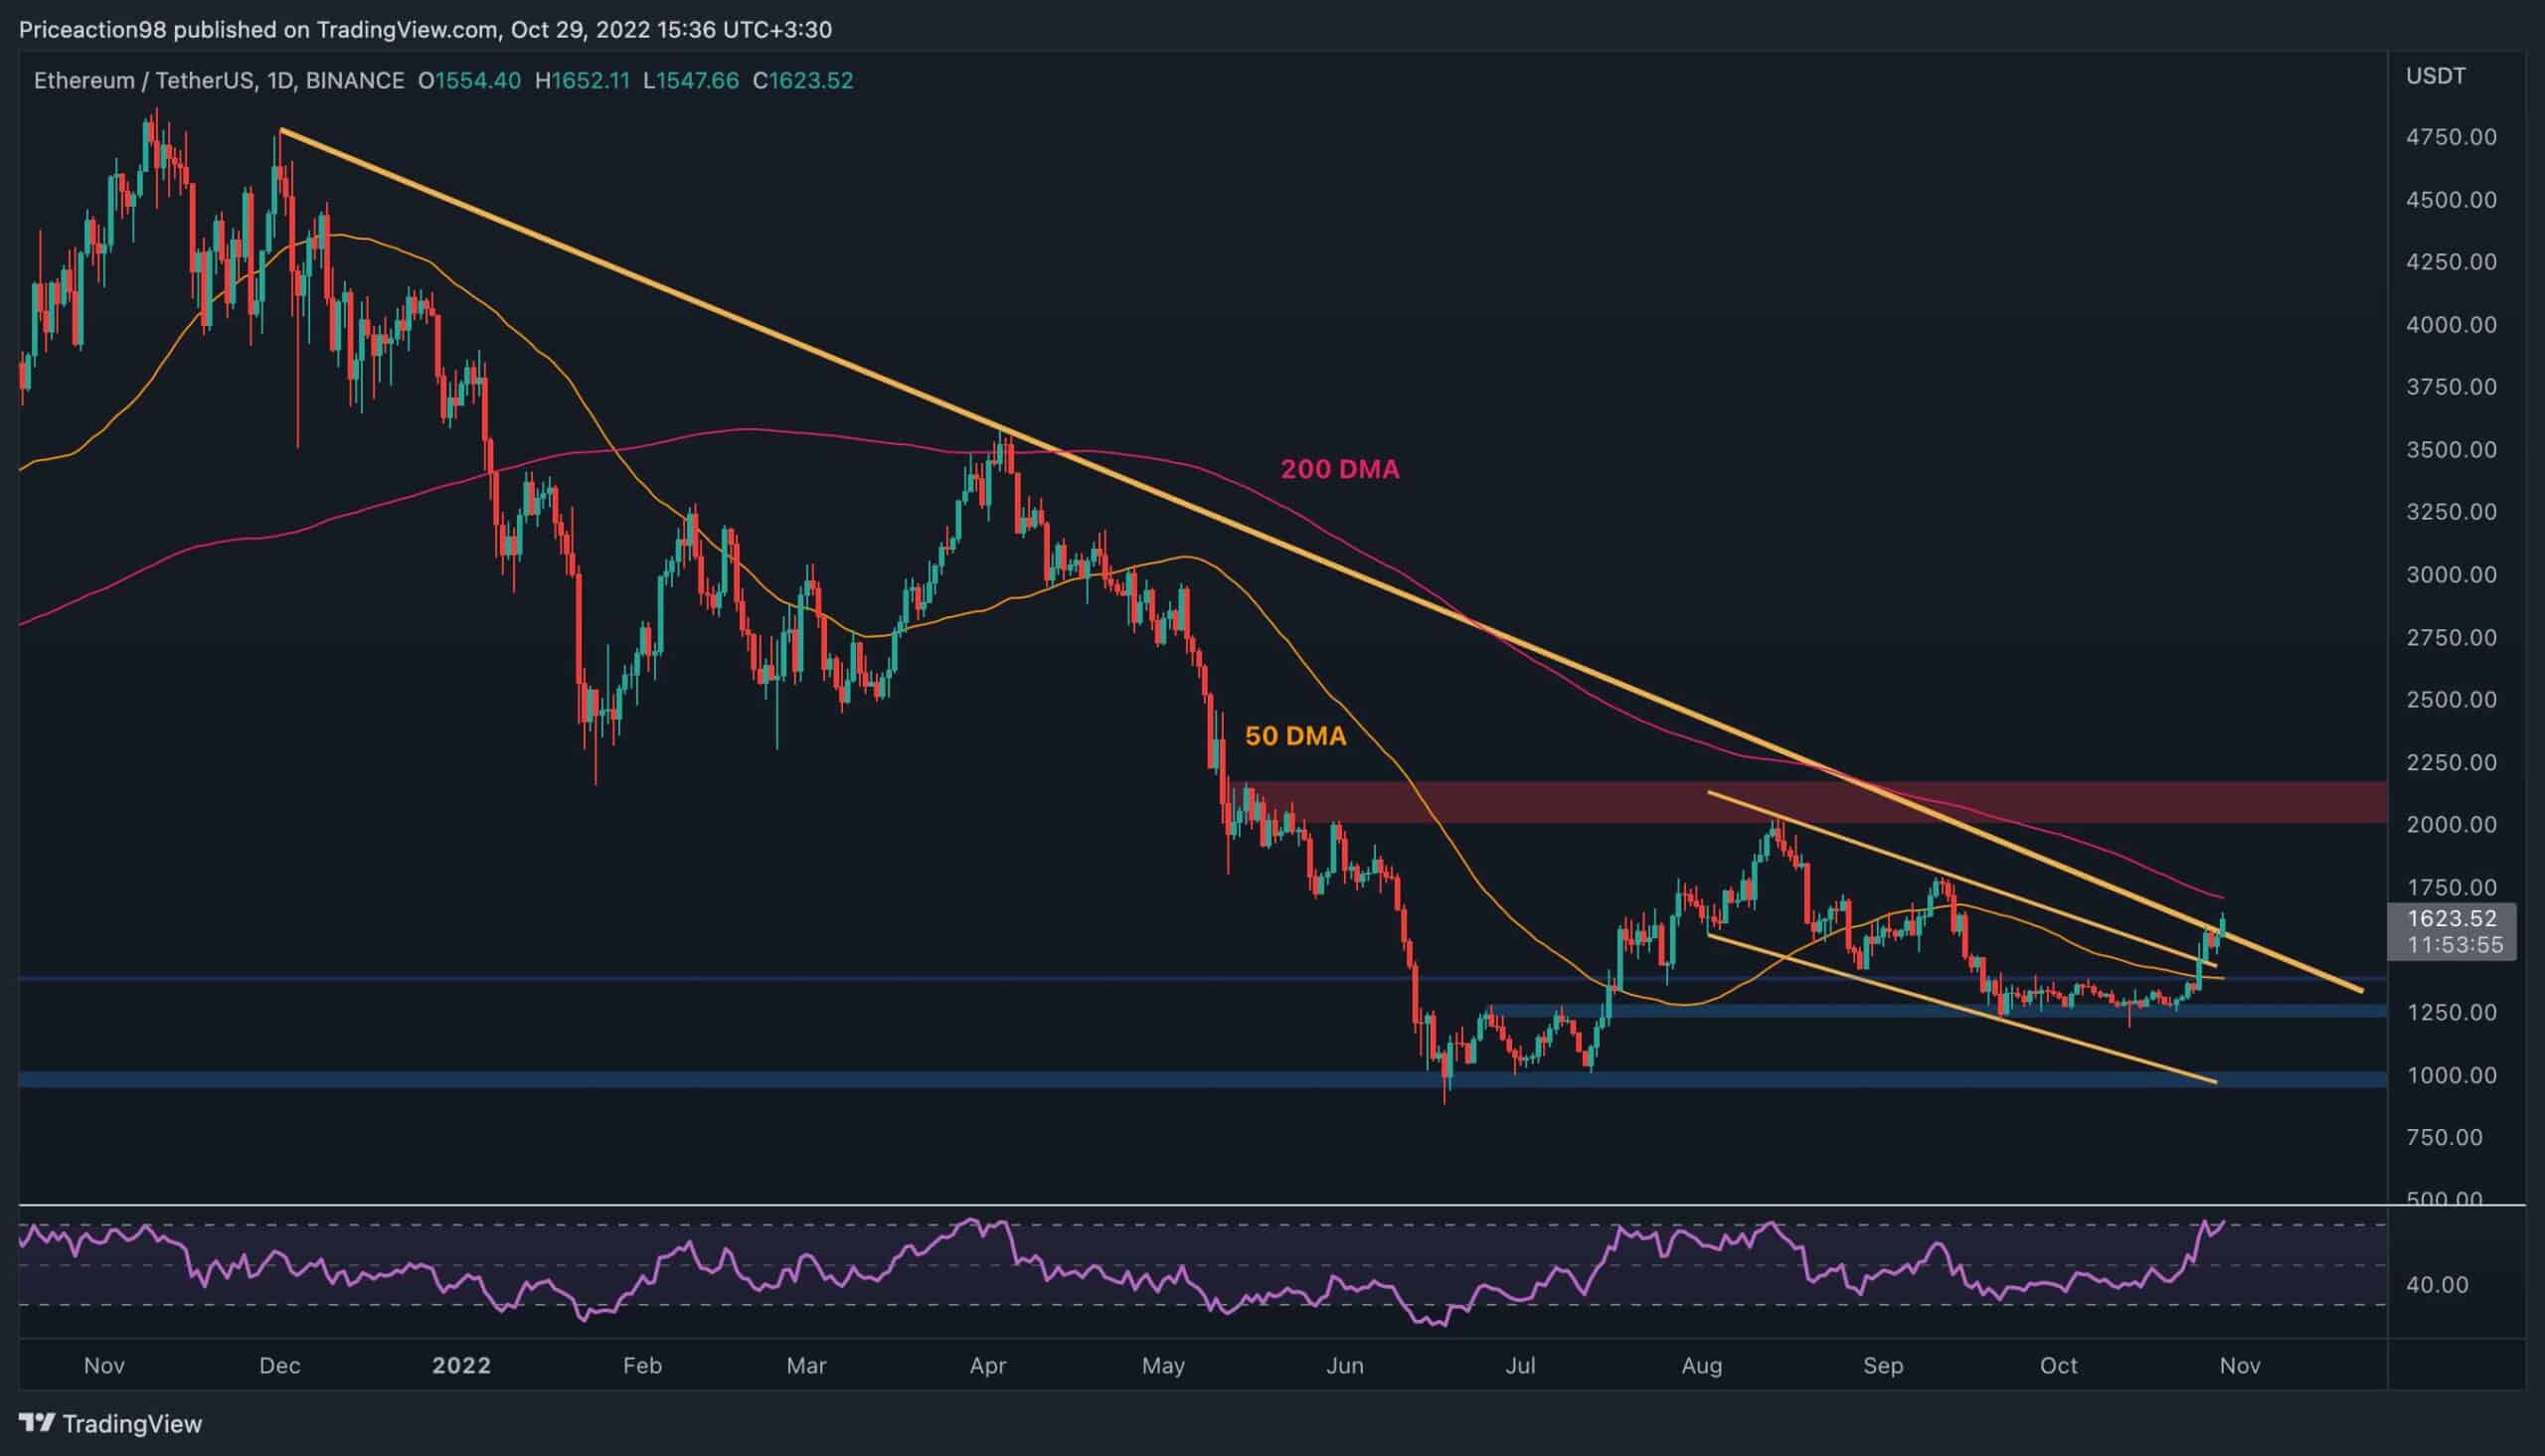
Daily Chart
On the daily timeframe, the price has broken the descending channel pattern to the upside after a rebound from the $1250 support level. The significant bearish trendline is also being tested at the moment, and the price seems to be breaking this to the upside as well.
From a classical price action standpoint, the market should easily reach the $2000 resistance level, as there is little to stand in its way. However, when analyzing the 200-day moving average, currently located around the $1700 mark, it’s clear that this could be a substantial obstacle for Ethereum.

If the price successfully breaks above the aforementioned moving average and, eventually, the $2000 resistance zone, the market structure would finally be considered bullish following months of a continuous downtrend. As a result, ETH could reach higher prices in the mid-term.
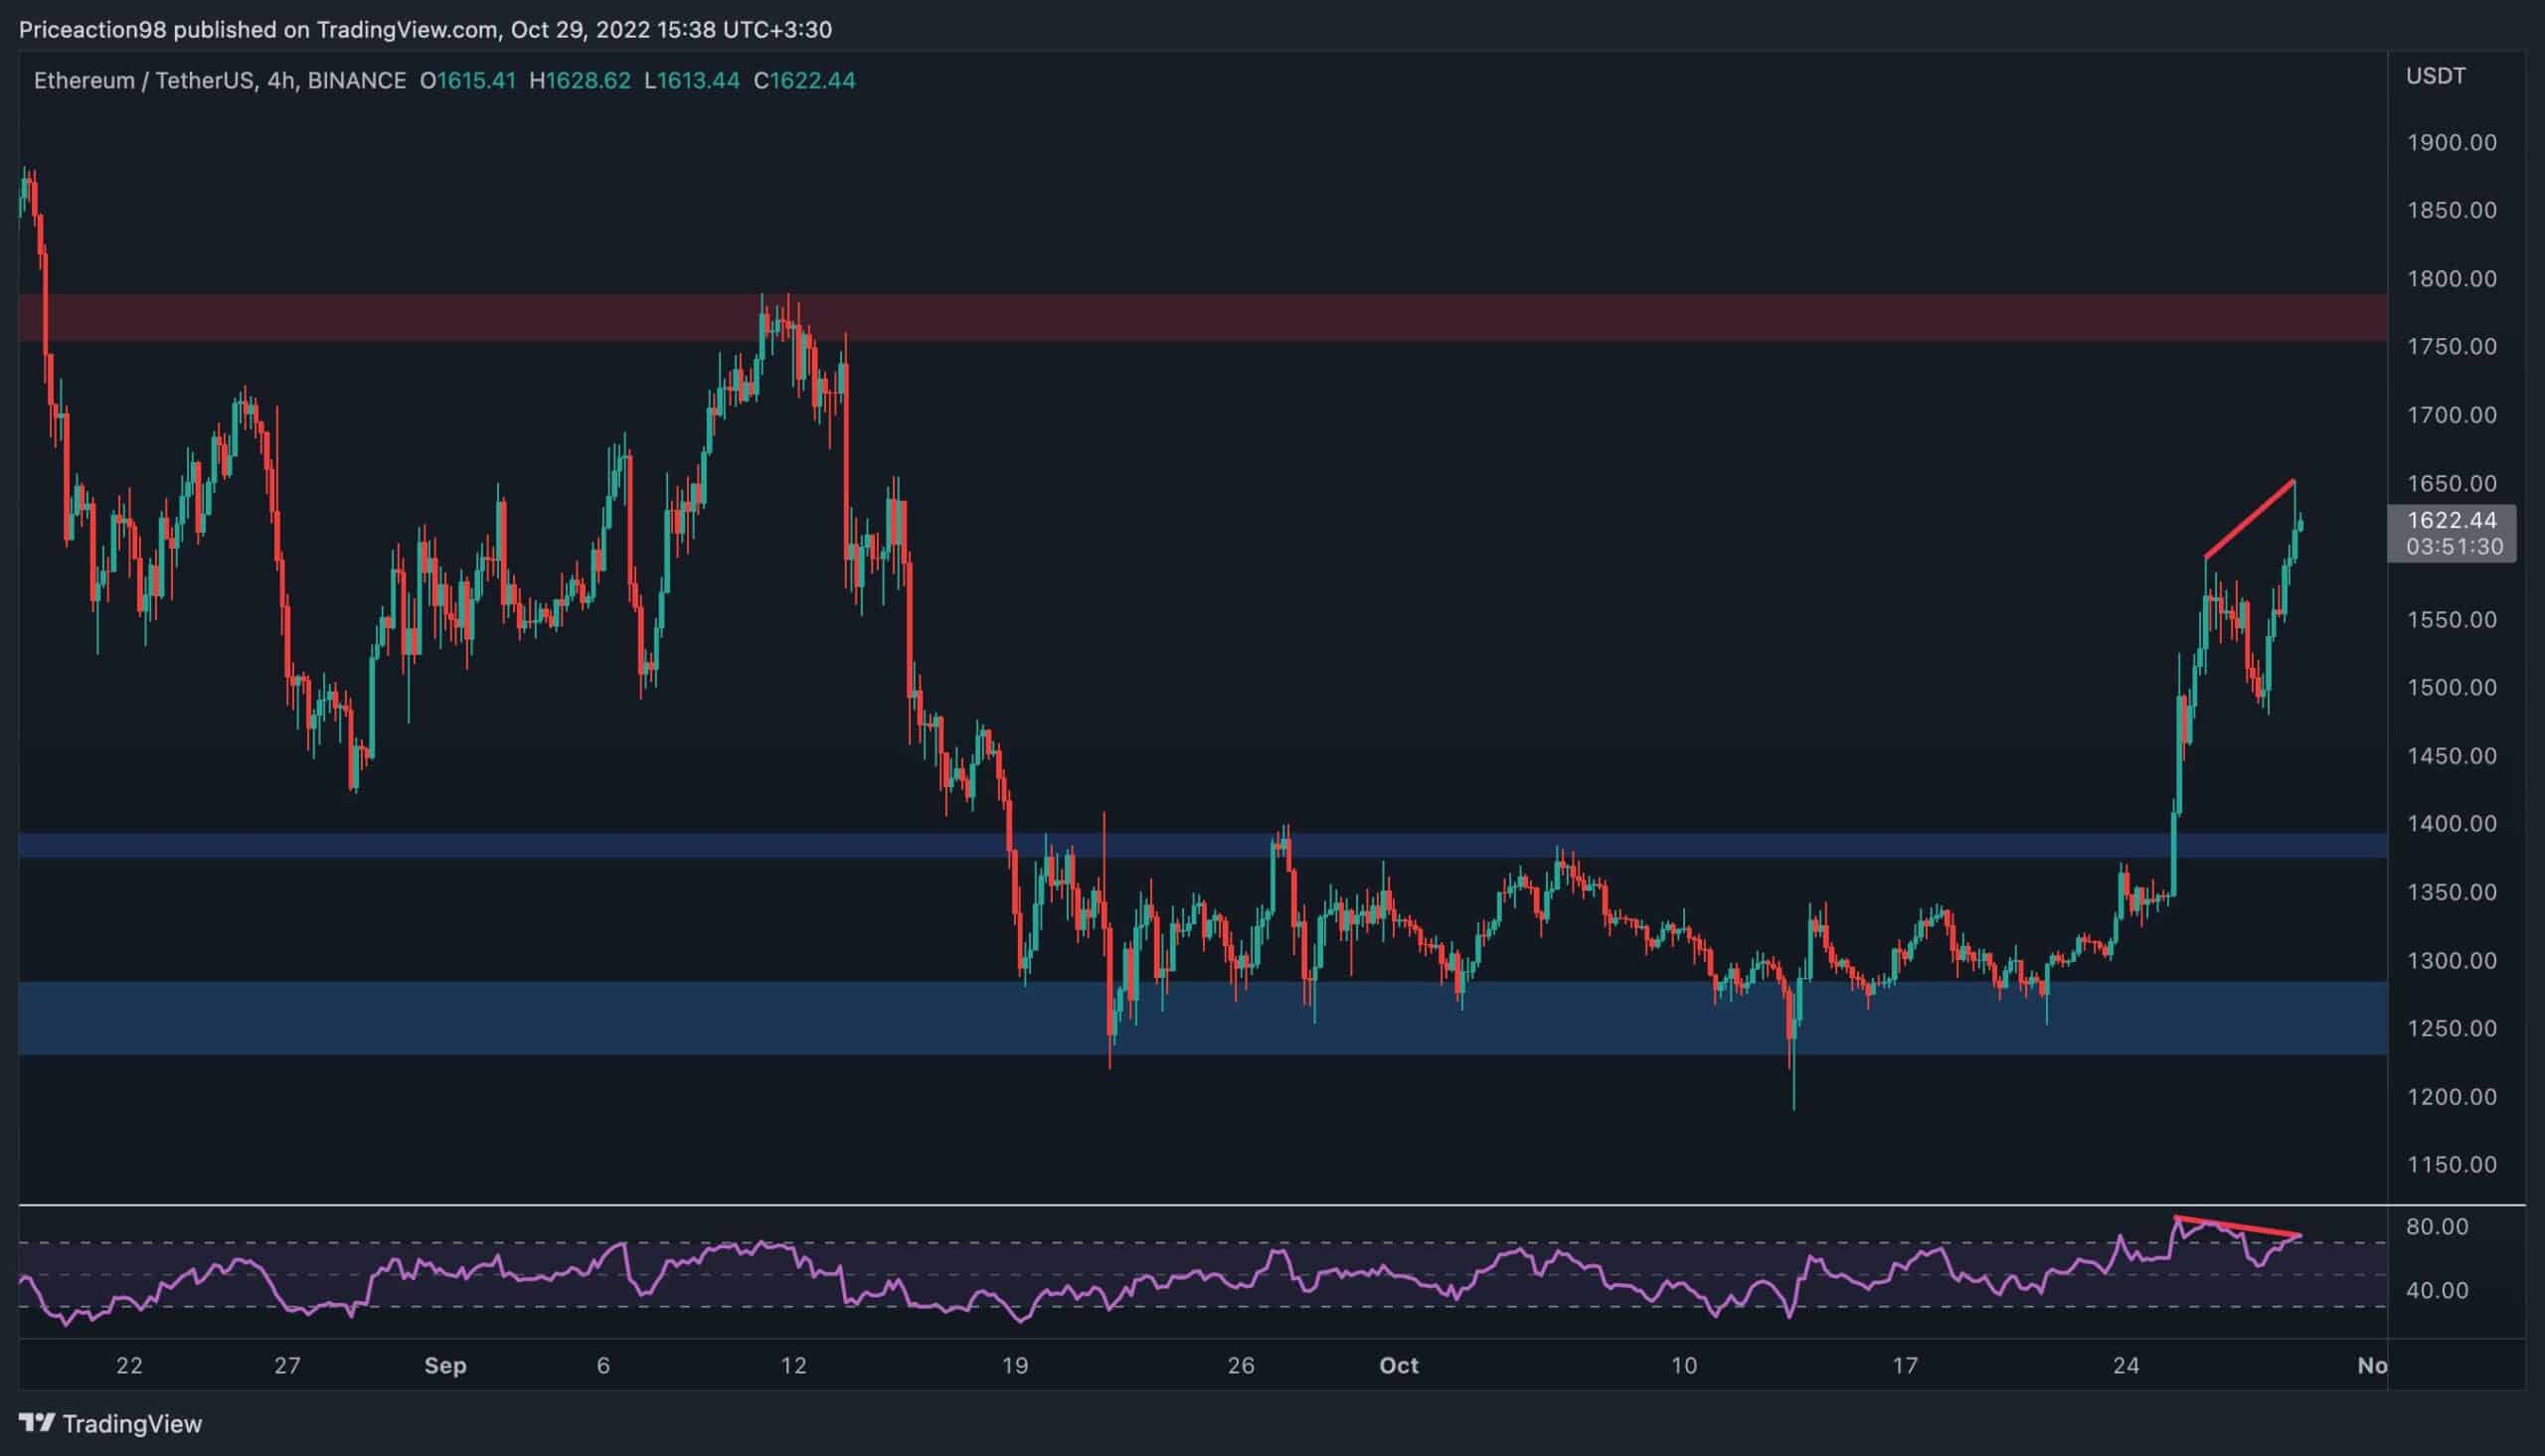
4 сааттык диаграмма
The 4-hour timeframe is also looking bullish as the market has impulsively broken above the $1400 level, rallying toward the $1800 resistance area.
However, the RSI indicator is currently demonstrating a clear bearish divergence. This signal points to a possible correction or reversal in the near future, with the former scenario being more probable as there appear to be minimal static resistance levels before the $1800 level.
In the event of a deep correction, the $1400 level could now be relied on as a key support level and push the price higher.
Сезим анализи
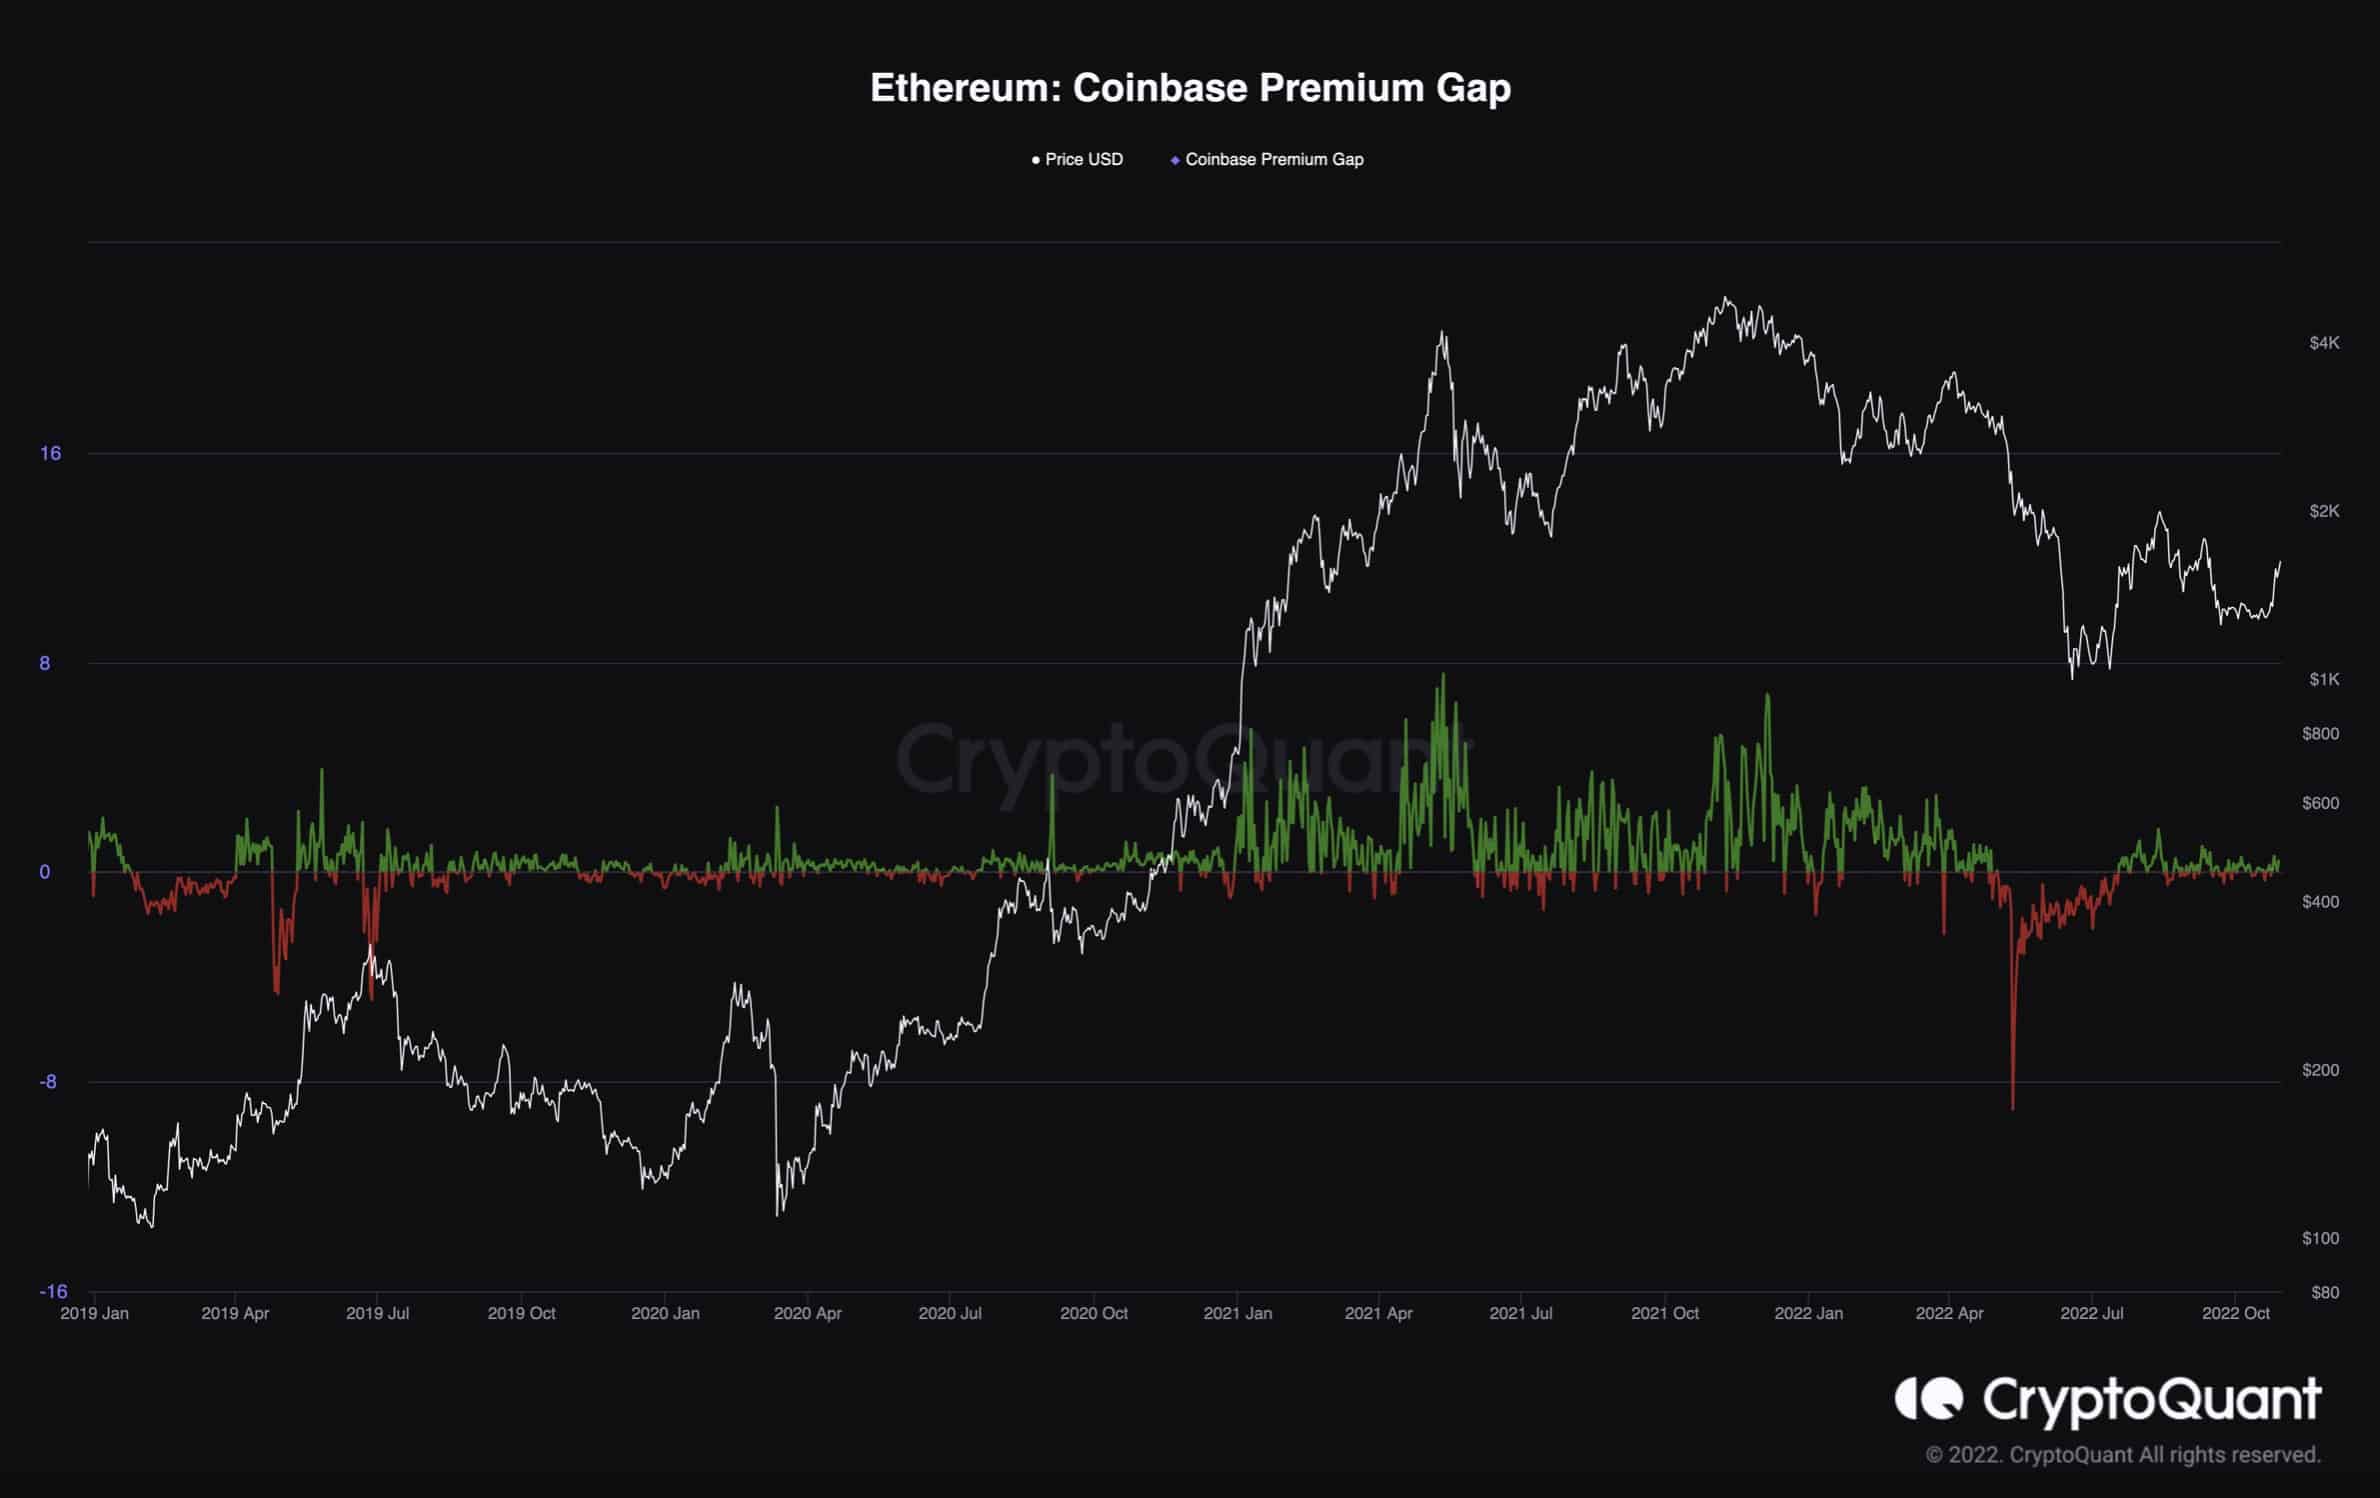
Ethereum Coinbase Premium Gap
The chart below demonstrates the Coinbase Premium Gap, which is the Ethereum price gap between Coinbase Pro and Binance. Values above 0 are interpreted as significant buying pressure in Coinbase. Values below 0 indicate high selling pressure by Americans.
It is evident that after a sharp drop below zero during May and June, this particular metric has since recovered and has been showing positive values over the last few months.
This signal is pointing to the fact that American investors have started accumulating ETH once again, which could be a bullish signal for the price, as they seem to find these prices fair for long-term investments.
Binance Акысыз $100 (Эксклюзив): бул шилтемени колдонуу Каттоо жана биринчи айда Binance Futures боюнча $100 бекер жана 10% арзандатуу жыйымдарын алуу (шарттары).
PrimeXBT атайын сунушу: бул шилтемени колдонуу каттоодон өтүңүз жана депозиттериңиз боюнча 50 долларга чейин алуу үчүн POTATO7,000 кодун киргизиңиз.
Disclaimer: маалыматтар келтирилген жазуучулар ошол CryptoPotato бар табылган. Бул CryptoPotato сатып, сатуу, же кандайдыр бир салымдарды өткөрөбү же жокпу деген пикирин билдирбейт. Сиз салым чечим болбосун чыгарарда өз изилдөөлөрдү жүргүзүү сунушталат. Өз тобокелге камсыз кылган маалыматты колдонобуз. Көбүрөөк маалымат алуу үчүн тартууну карагыла.
Cryptocurrency схемалар менен TradingView.
Source: https://cryptopotato.com/eth-soars-above-1600-but-is-a-correction-coming-ethereum-price-analysis/