Just like the traditional markets, the crypto markets reacted badly to yesterday’s speech by Powell. Following the announcement of the continuation of the hawkish policy of the Federal Reserve, the market sentiment is bearish. Yesterday’s selloff caused Ethereum to lose more than 12% in under 24 hours. Is more pain incoming?
Техникалык анализ
менен: Grizzly
Daily Chart
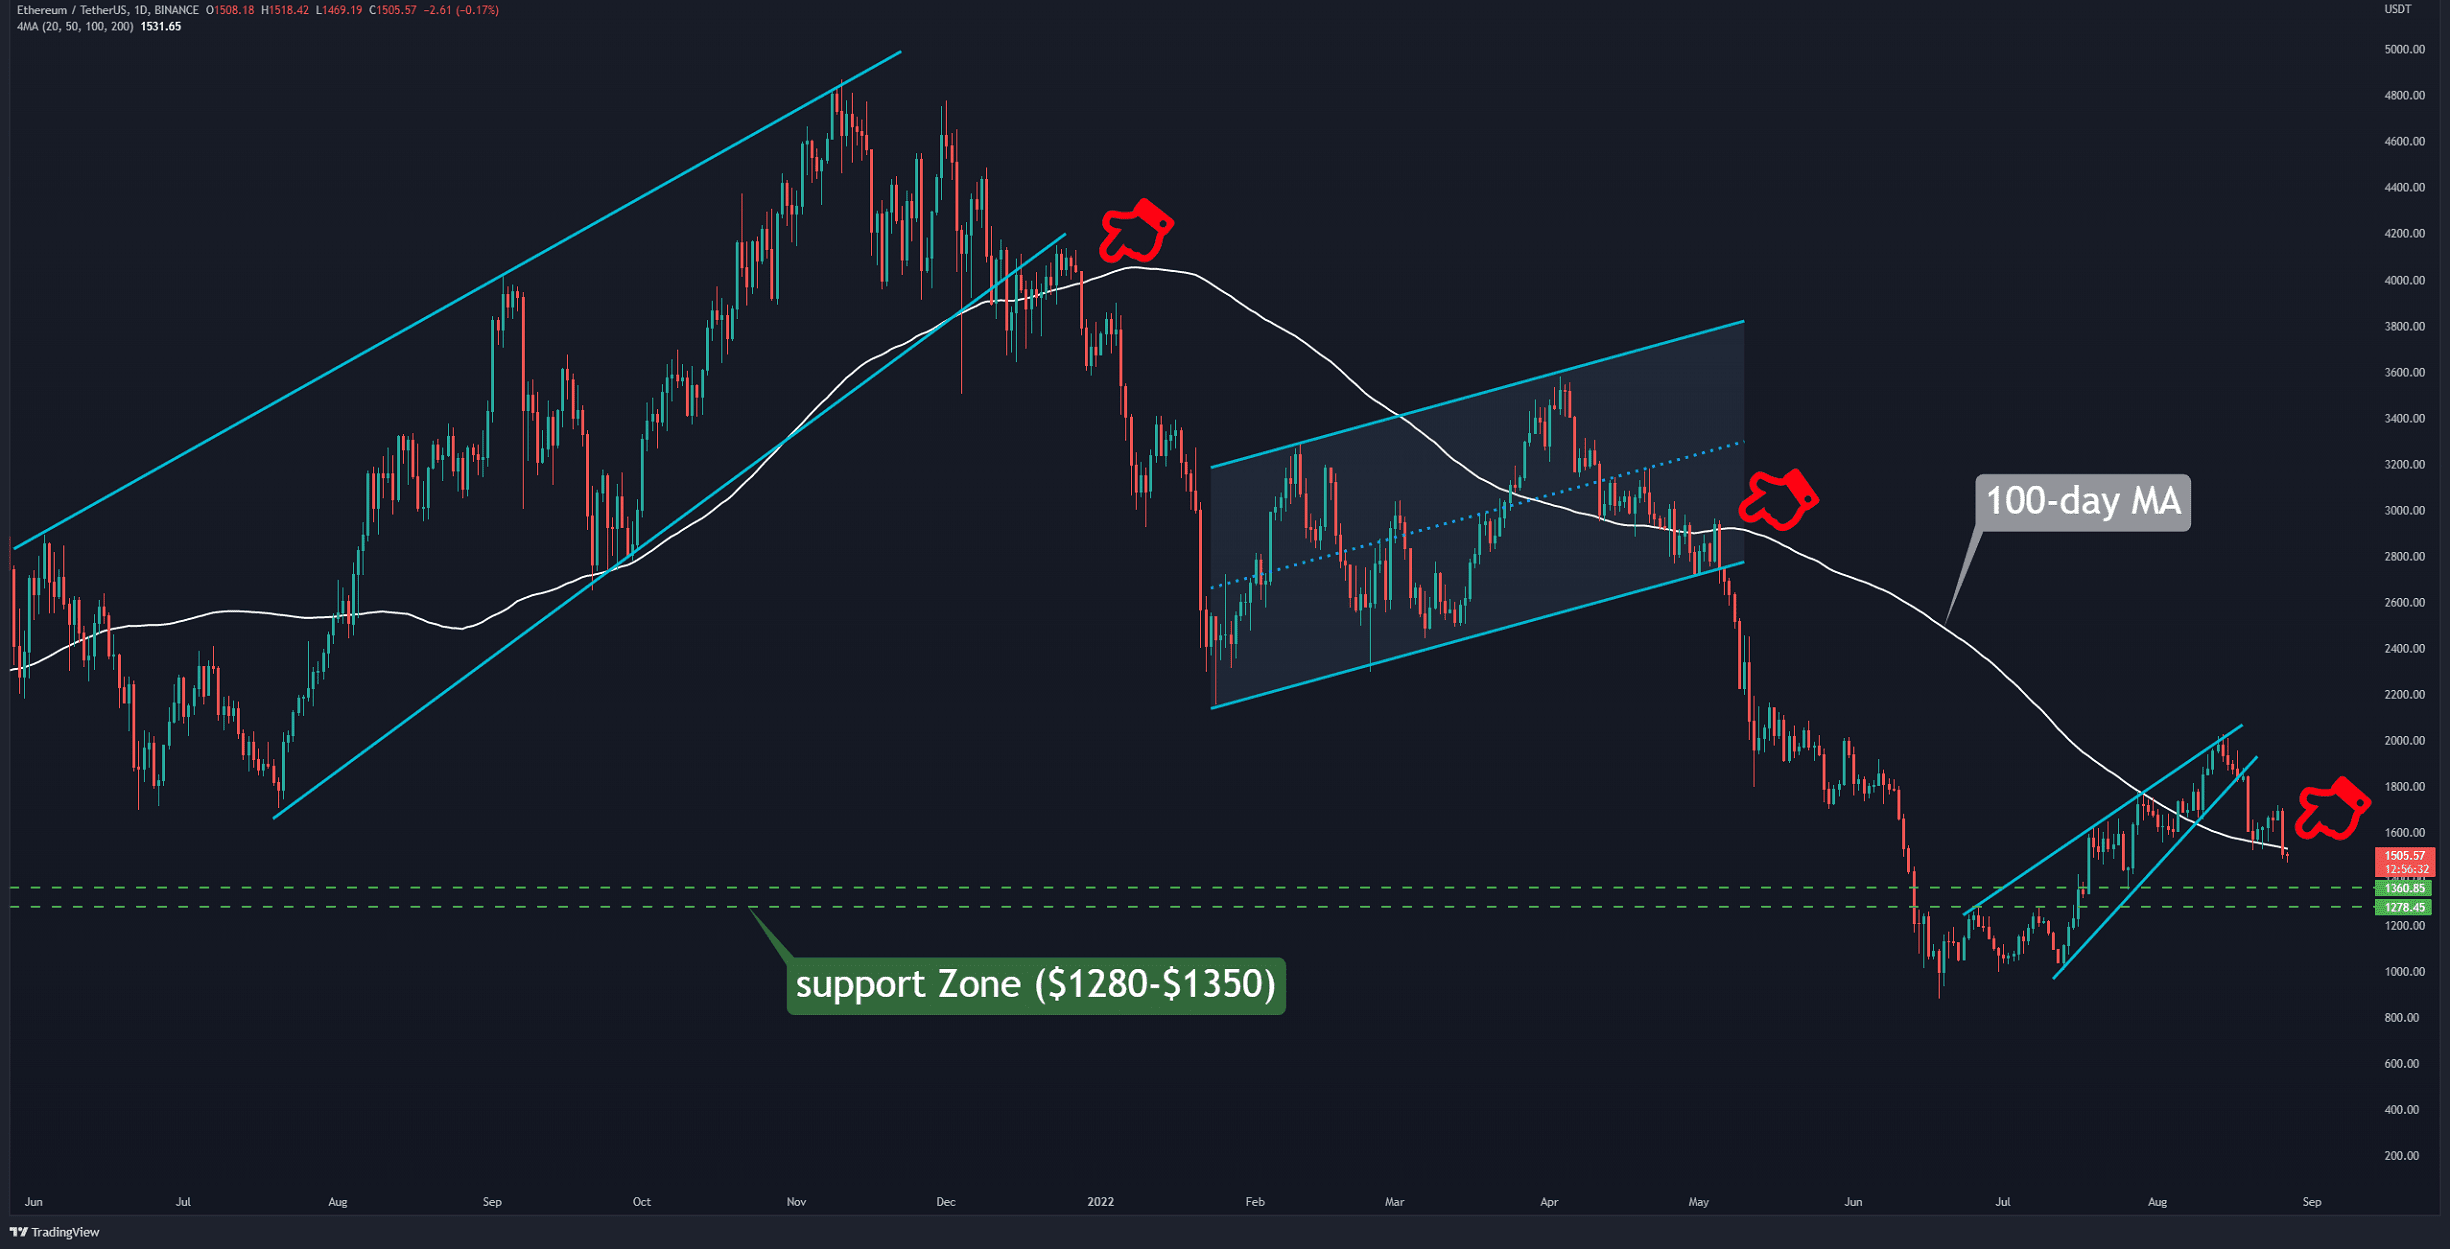
The price of Ethereum fell sharply against the US dollar and Bitcoin yesterday. The short uptrend that started on August 21 resulted in a sharp rejection once touching the $2K mark.
ETH then quickly lost the important support range of $1,700-$1,800, and as of writing these lines – trading below $1500.
The price has experienced severe drops after breaking below the two marked bear flags, as seen on the chart. Simultaneously, the price broke below the 100-day moving average line (in white). Currently, the average value of the 100-day chart is $1,531. Bears are now attempting to close the daily candle beneath it.
With a lower low formation, the possibility of reaching the support zone at $1,280-$1,350 (in green) will become likely. Hope will return to the market only if the bulls can reclaim the $1,700 – 1,800 range.

Негизги колдоо деңгээлдери: $ 1500 & $ 1350
Негизги каршылык деңгээлдери: $ 1800 & $ 2000
Күнүмдүк кыймылдуу орточо көрсөткүчтөр:
MA20: $1750
MA50: $1592
MA100: $1531
MA200: $2184
ETH/BTC диаграммасы
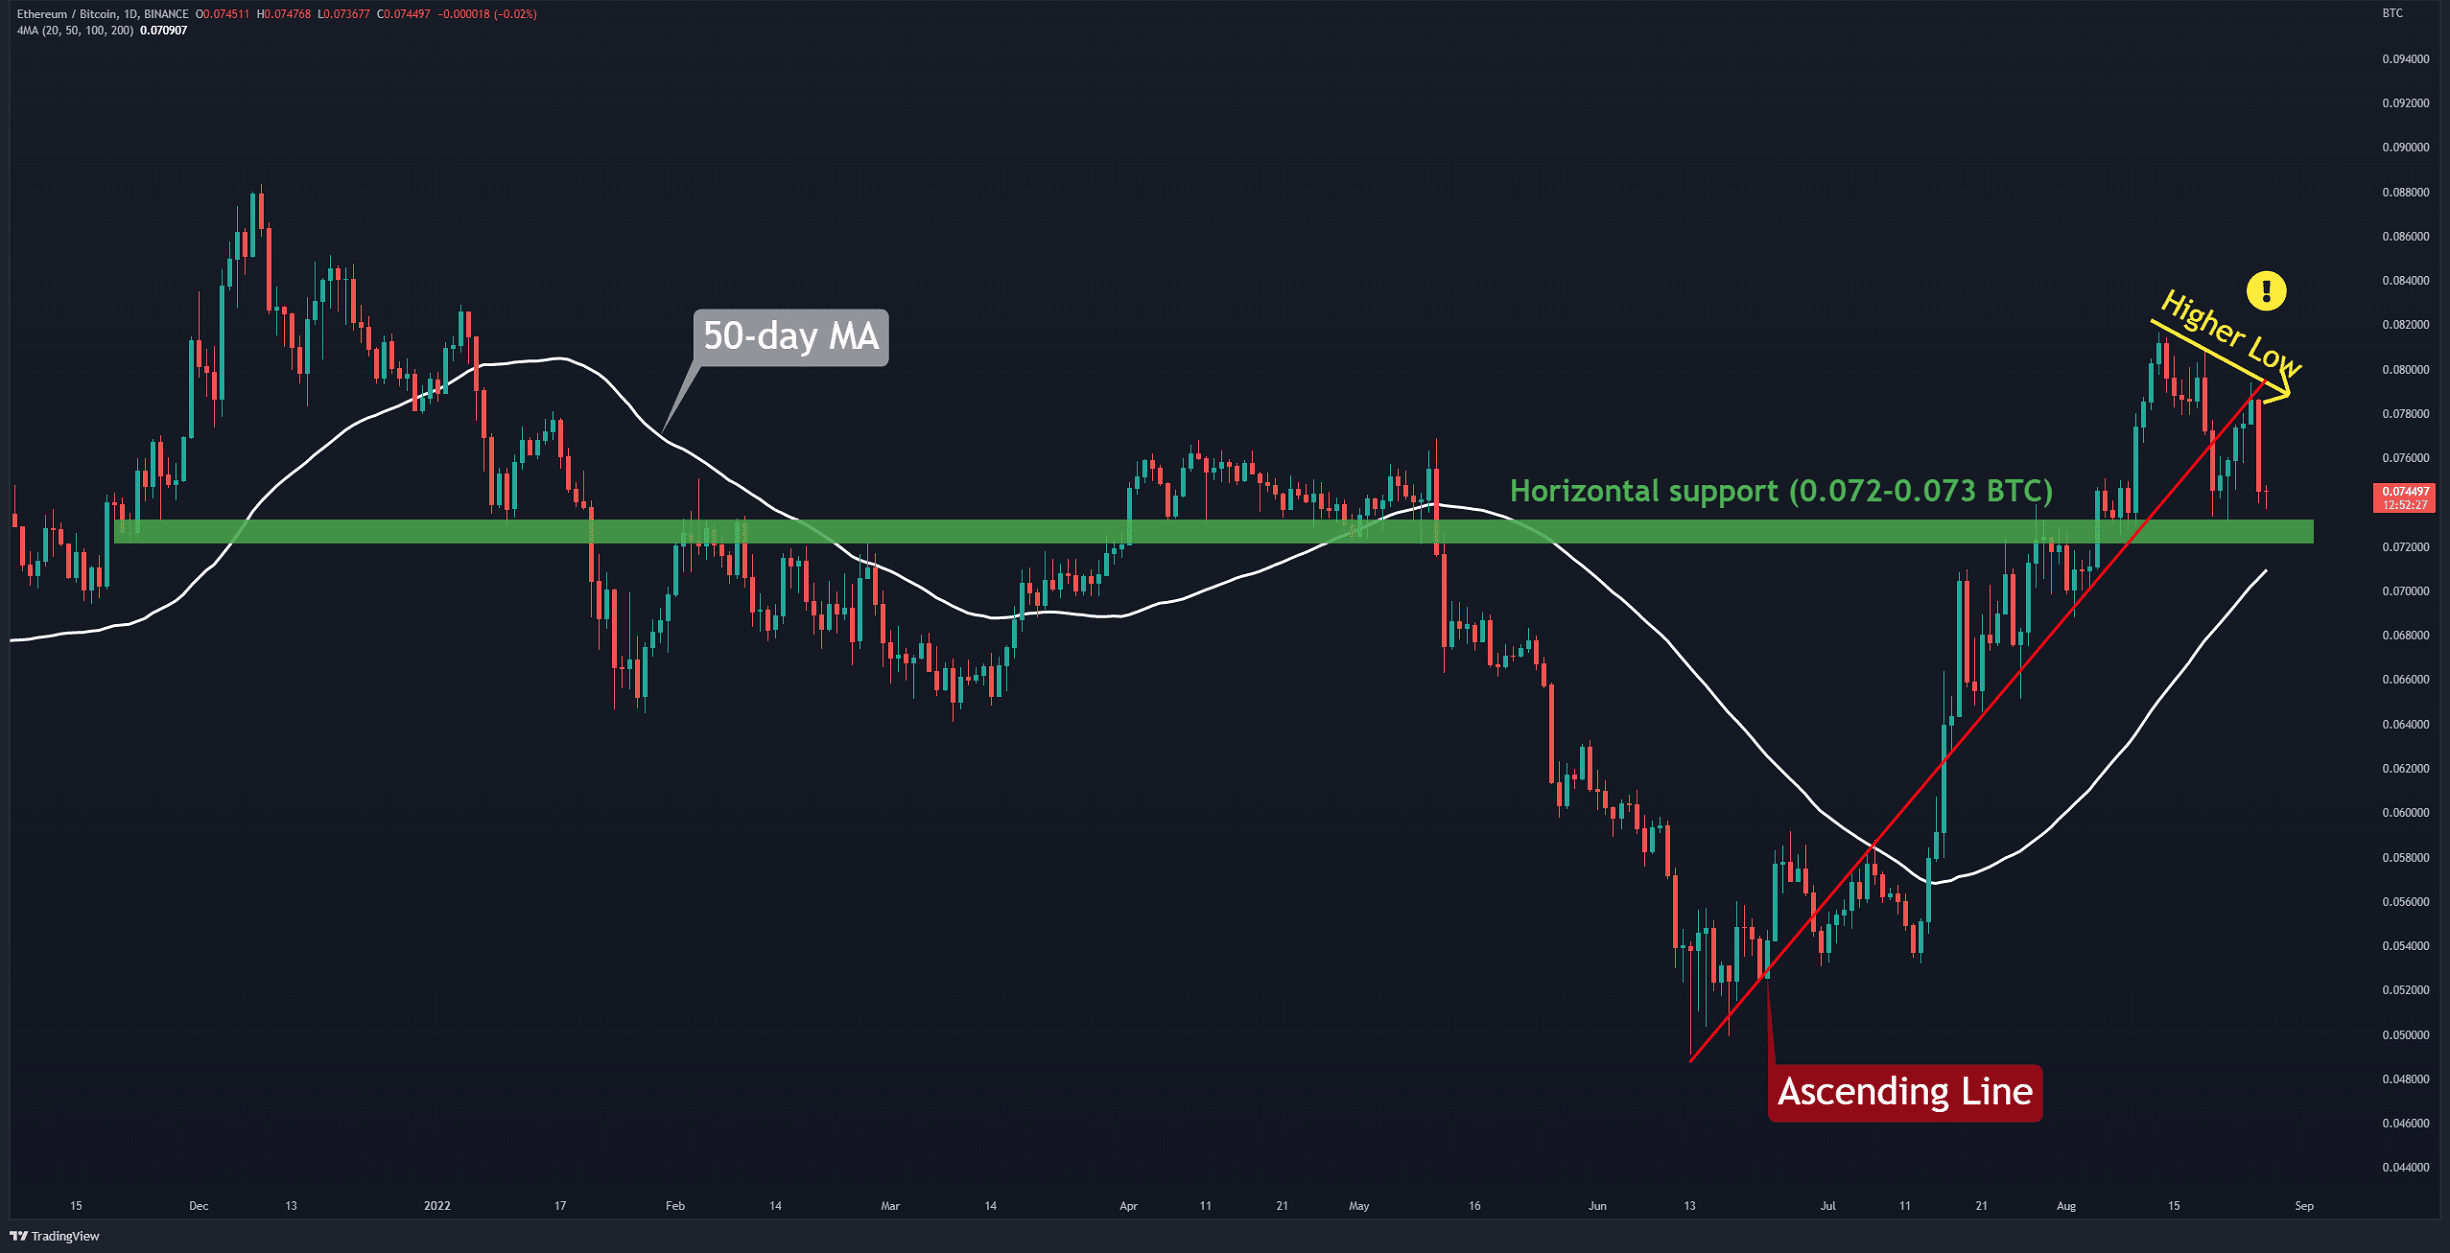
Against Bitcoin, the price rebounded from the horizontal support range of 0.072-0.073 BTC (marked in green) and failed to form a higher high (marked in yellow). This is a warning sign and could result in a formation of a potential bearish structure. This option will be valid only if ETH breaks below the green line.
The 50-day moving average (in white) is also nearby and likely to get retested. The next critical support is found at around 0.065 BTC. On the other hand, which is unlikely now, if the price breaks above the last high at 0.08 BTC, a bullish scenario of ETH/BTC becomes likely.
Негизги колдоо деңгээлдери: 0.0.073 & 0.065 BTC
Негизги каршылык деңгээлдери: 0.083 & 0.088 BTC
Сезим анализи
Такер Сатып алуу Сатуу катышы (SMA 14)
аныктамасы: Сатып алуу көлөмүнүн катышы түбөлүк своп соодасында кабыл алуучулардын сатуу көлөмүнө бөлүнөт.
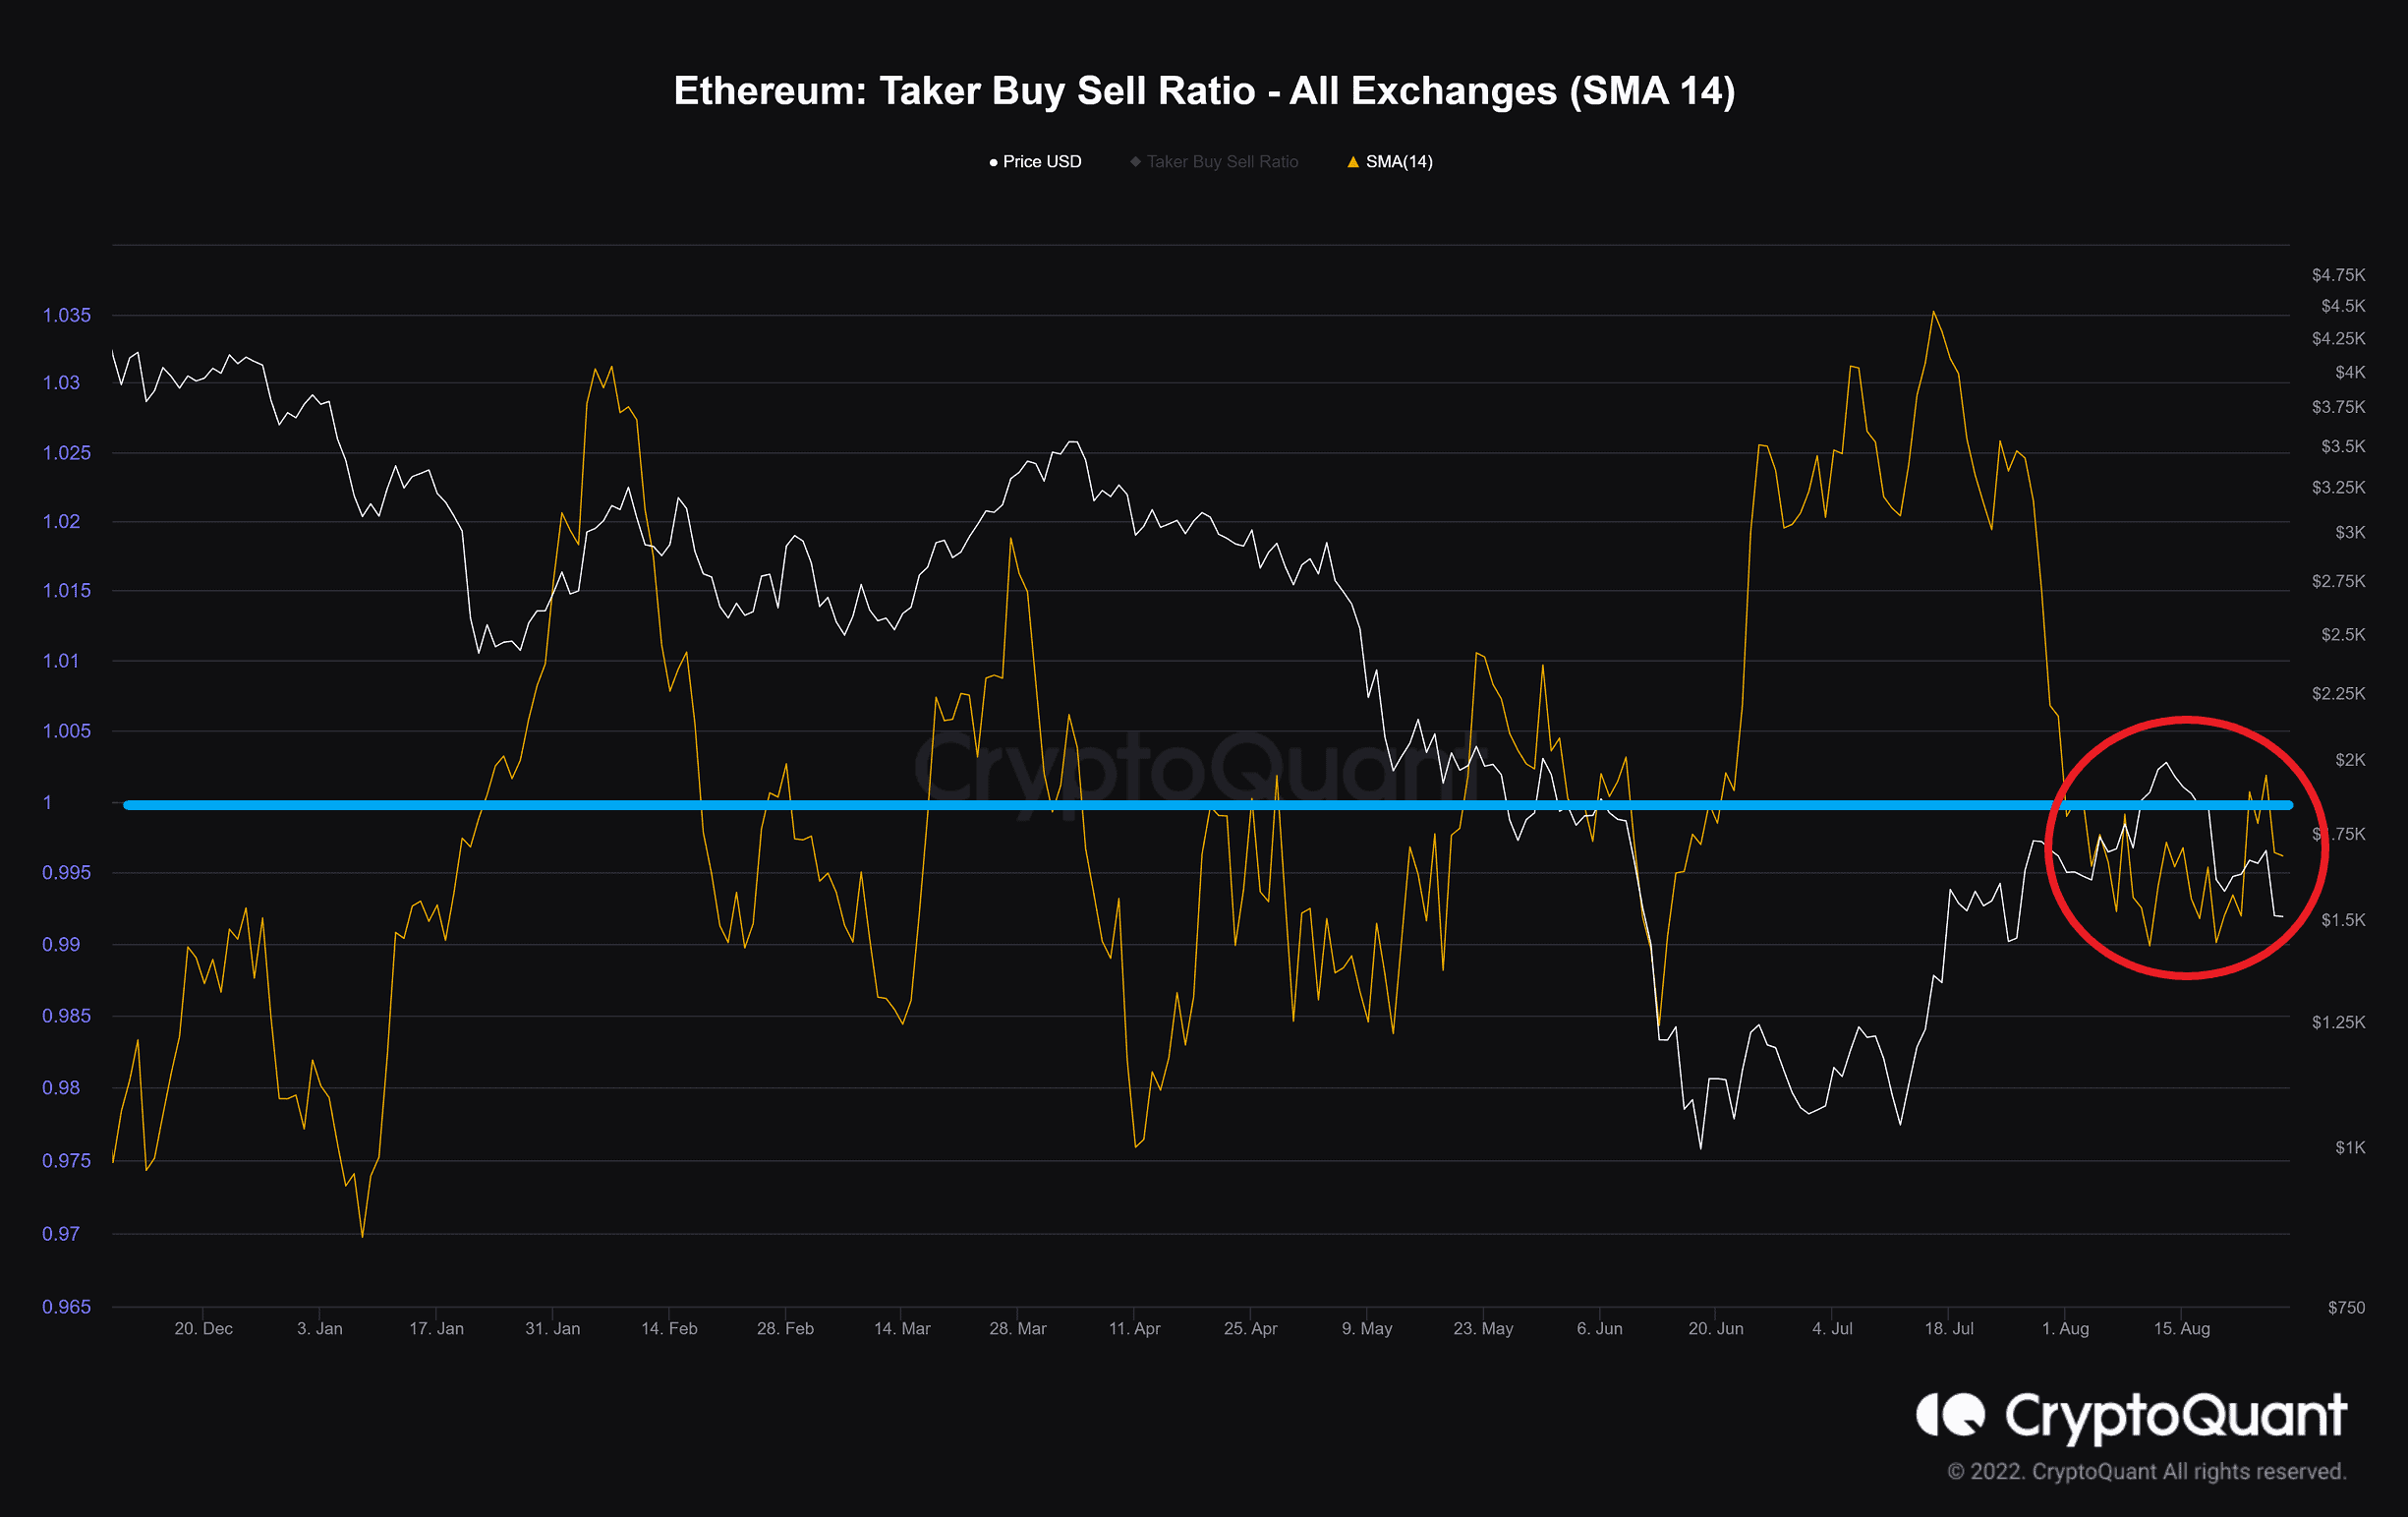
Values over 1 indicate bullish sentiment is dominant. Values under 1 indicate bearish sentiment is dominant.
This index, which measures sentiments in the derivatives market, has been below one since the beginning of August. This suggests that takers fill more sell orders. It has increased slightly recently but not enough to be significant.
Binance Акысыз $100 (Эксклюзив): бул шилтемени колдонуу Каттоо жана биринчи айда Binance Futures боюнча $100 бекер жана 10% арзандатуу жыйымдарын алуу (шарттары).
PrimeXBT атайын сунушу: бул шилтемени колдонуу каттоодон өтүңүз жана депозиттериңиз боюнча 50 долларга чейин алуу үчүн POTATO7,000 кодун киргизиңиз.
Disclaimer: маалыматтар келтирилген жазуучулар ошол CryptoPotato бар табылган. Бул CryptoPotato сатып, сатуу, же кандайдыр бир салымдарды өткөрөбү же жокпу деген пикирин билдирбейт. Сиз салым чечим болбосун чыгарарда өз изилдөөлөрдү жүргүзүү сунушталат. Өз тобокелге камсыз кылган маалыматты колдонобуз. Көбүрөөк маалымат алуу үчүн тартууну карагыла.
Cryptocurrency схемалар менен TradingView.
Source: https://cryptopotato.com/eth-facing-huge-support-zone-is-more-blood-incoming-ethereum-price-analysis/