BeInCrypto ушул жуманын крипто рыногунда, атап айтканда, 19-майдан 26-майга чейин эң көп өскөн беш альткоинди карайт.
Альткоин термини Биткойндон (BTC) башка криптовалюталарды билдирет. Бул өсүүчү альткоиндер ушул аптада крипто жаңылыктарын жана криптовалюталар рыногунун көңүлүн буруп, эң чоң пайда табышкан:
- Render Token (RNDR) price increased by 15.40%
- Kava (KAVA) баасы 14.59% га жогорулады
- TRON (TRX) price increased by 9.49%
- SingularityNET (AGIX) price increased by 6.06%
- IOTA (IOTA) price increased by 5.45%
Render Token (RNDR) Price Leads Bullish Altcoin Gainers
The RNDR price has moved upward since the start of the year. On May 11, it bounced after a low of $1.62 and accelerated its rate of increase. This led to a new yearly high of $2.95 on May 21.
After a brief drop, the price regained its footing, and it is now making another attempt at reaching a new yearly high.
According to the wave count, the price can reach a high of $3.33 before falling. By studying recurring long-term price patterns and investor psychology, technical analysts utilize the Elliott Wave theory to ascertain the trend’s direction.
The target is found by giving wave five the same length as waves one and three combined.
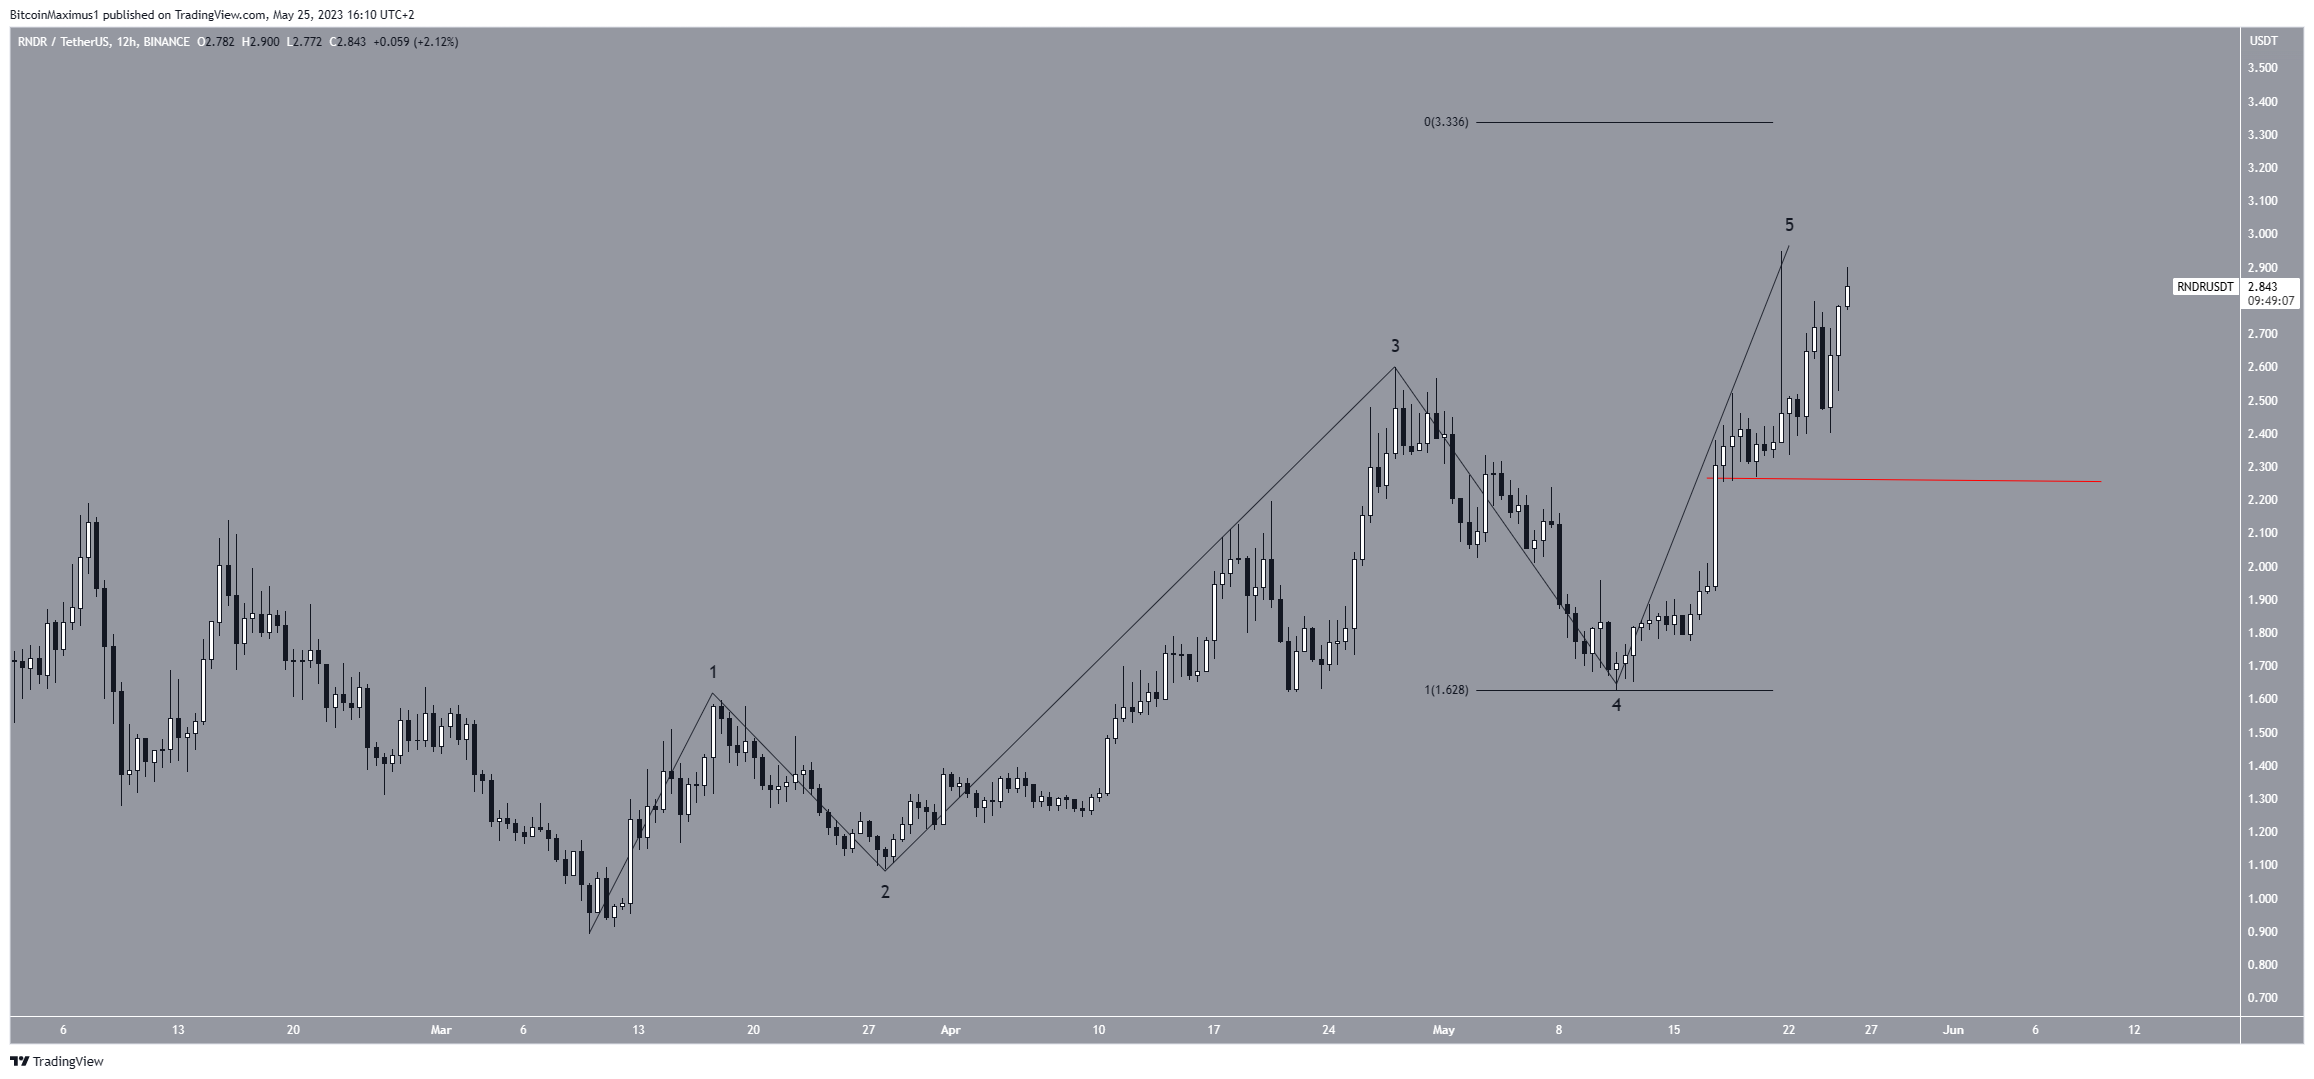
Despite this bullish RNDR price prediction, a drop below the local low of $2.25 (red line) will mean that the trend is bearish.
In that case, a decrease to $1.70 will be the most likely scenario.
Kava (KAVA) Price Attempts to Clear Resistance
The KAVA price has increased rapidly since a low of $0.66 on May 8. The upward movement accelerated on May 23, leading to a high of $1.55 the same day, causing a breakout from the $1.10 resistance area.
However, the increase could not be sustained, and the price is back at the $1.10 horizontal area, seemingly validating it as support.
Whether KAVA breaks down or bounces could determine the future trend.
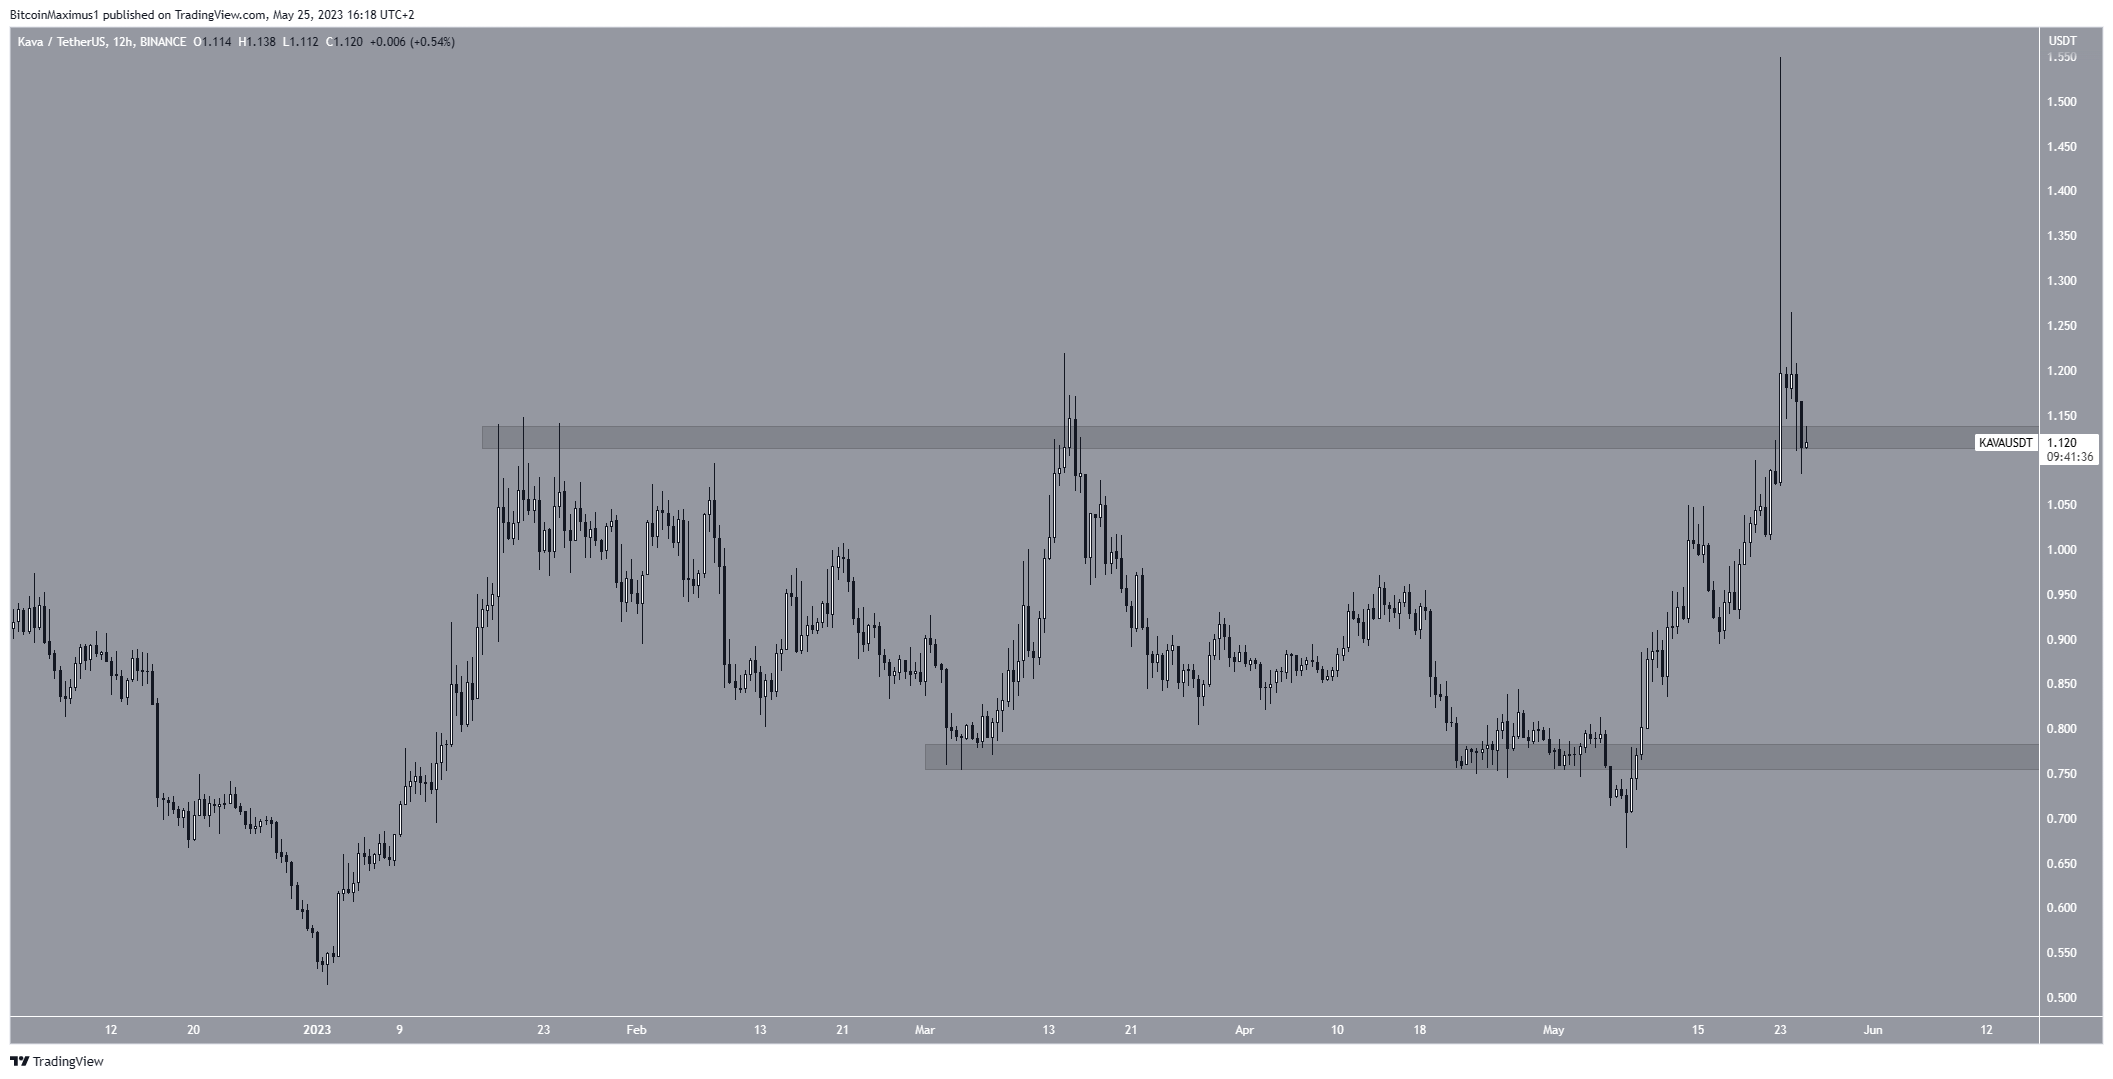
In case of a breakdown, KAVA could drop to the closest support area at $0.75.
However, if the price bounces, it could retest the $1.50 highs once more.
TRON (TRX) Price Clears Major Resistance
The TRX price has been increasing since March 11. While the price initially struggled to clear the $0.071 area, it was finally successful in doing so on May 20.
This led to a new yearly high of $0.080 on May 23.
The TRON price now trades in the middle of its $0.071-$0.088 range.
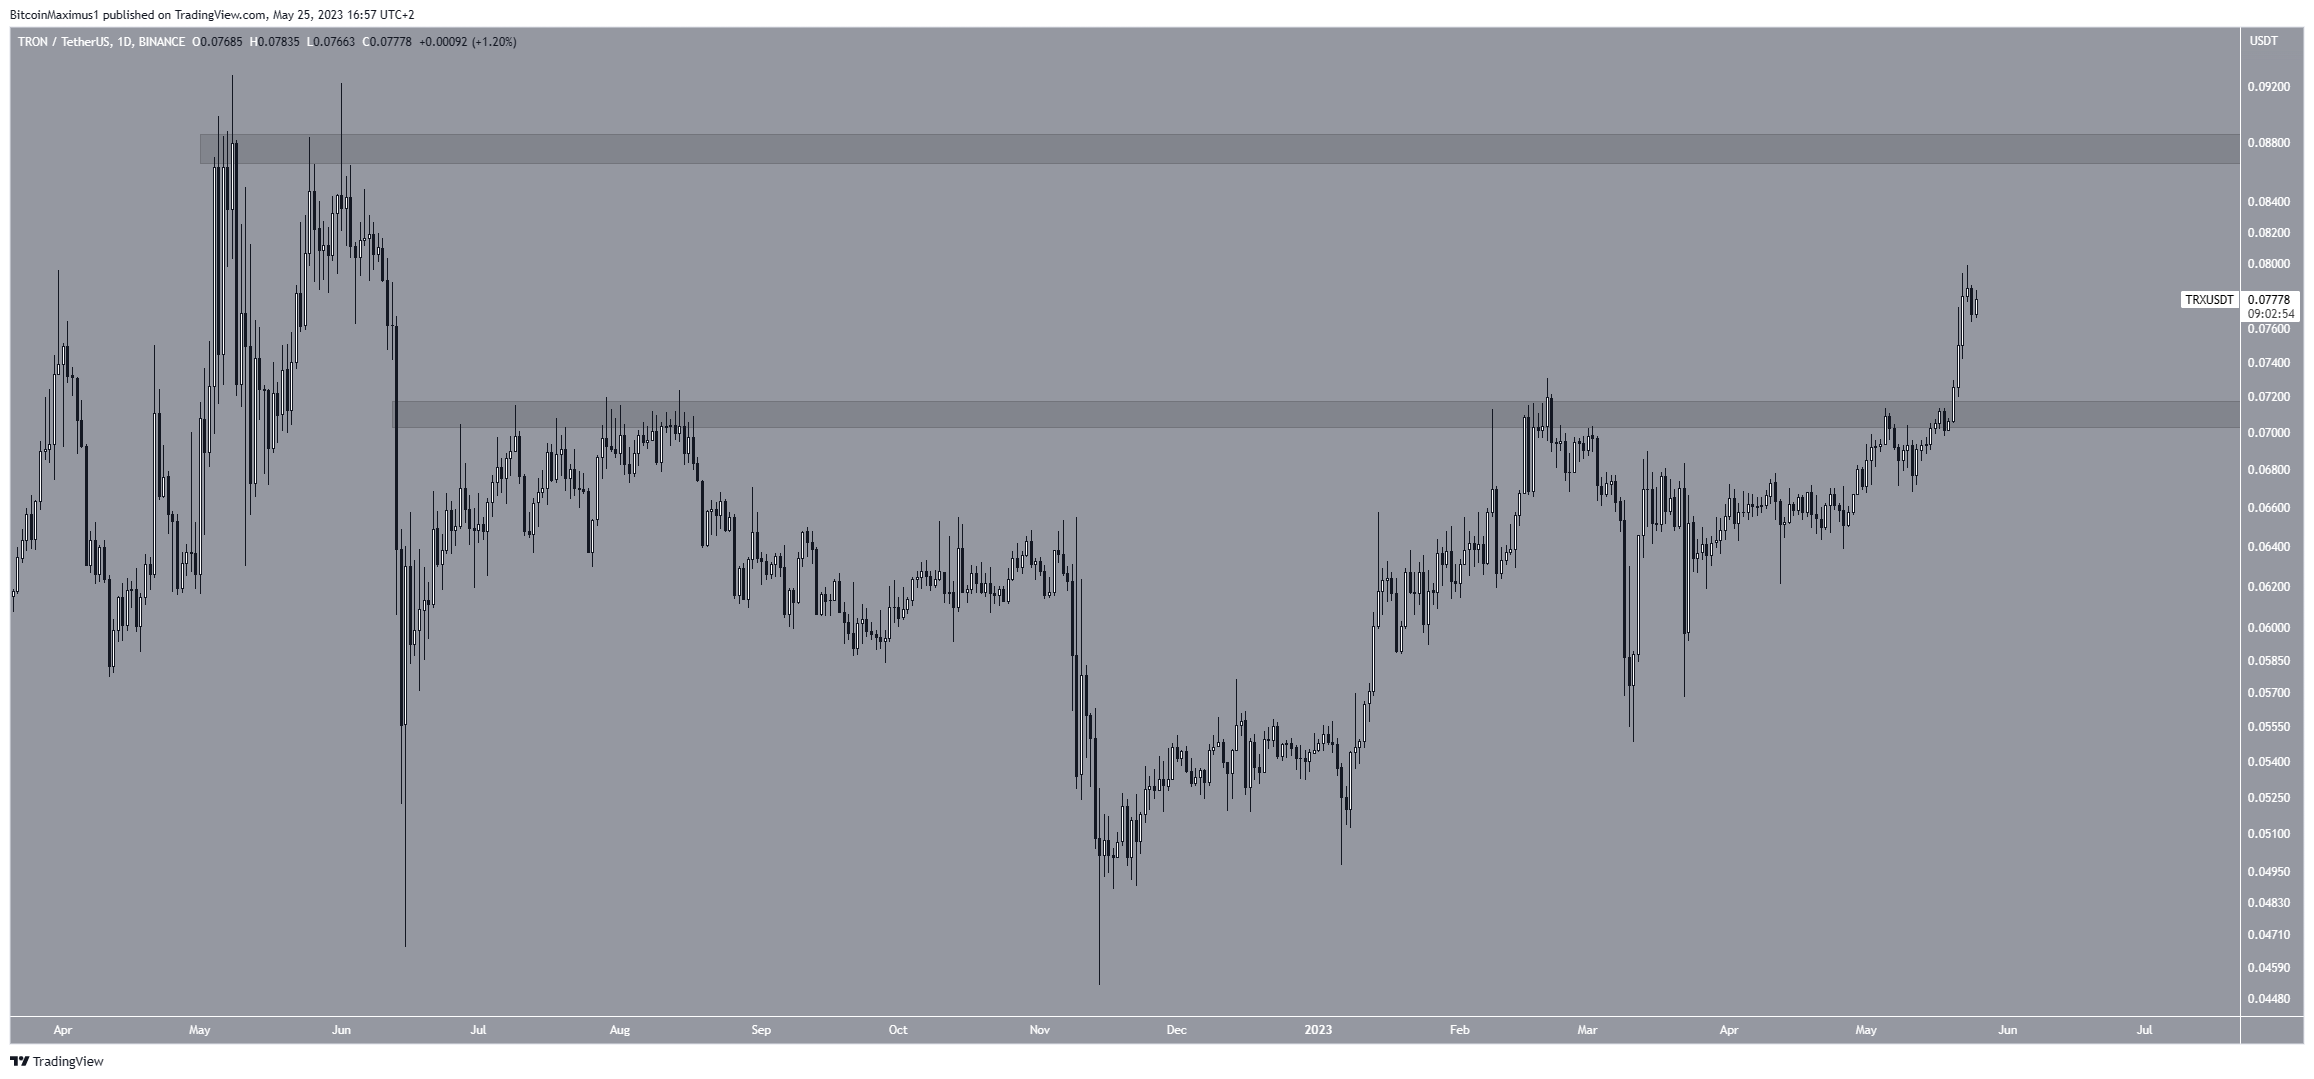
TRX can fall to the $0.071 area if the rally loses momentum. However, if the upward movement continues, the price can increase to the next resistance at $0.087.
SingularityNET (AGIX) Price Bounces at Support of Corrective Pattern
The AGIX price has decreased inside a descending parallel channel since February 8. The descending parallel channel is considered a corrective pattern. Therefore, a breakout from it is the most likely scenario.
On May 12, the price bounced at a confluence of support levels (green icon), created by the channel’s support line and the $0.23 support area.
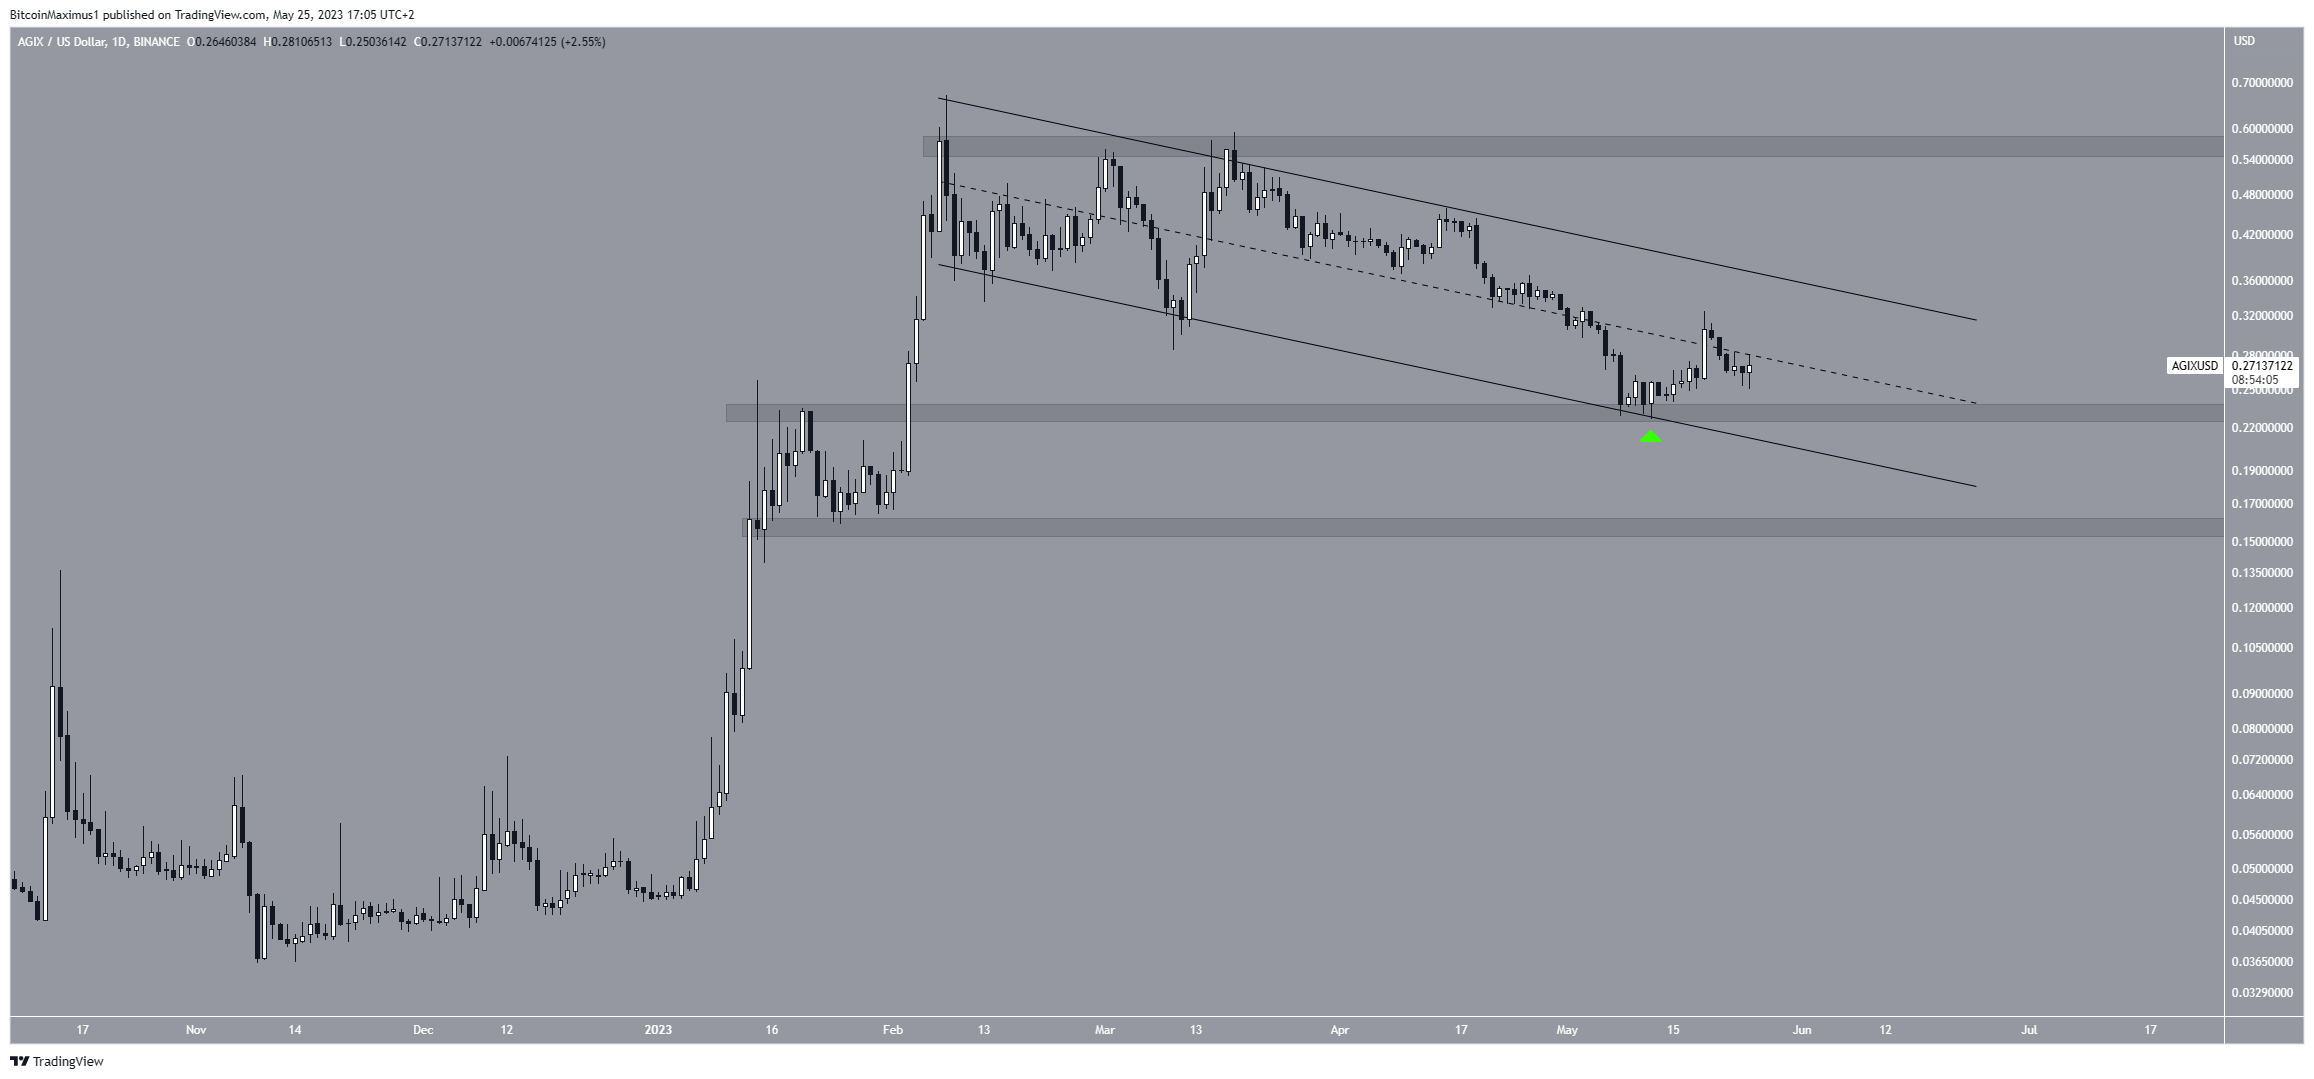
If the price breaks out from the channel, it can increase to the next resistance at $0.57.
However, if it breaks down from the $0.23 area and the channel, a decrease toward the $0.16 support area will be on the cards.
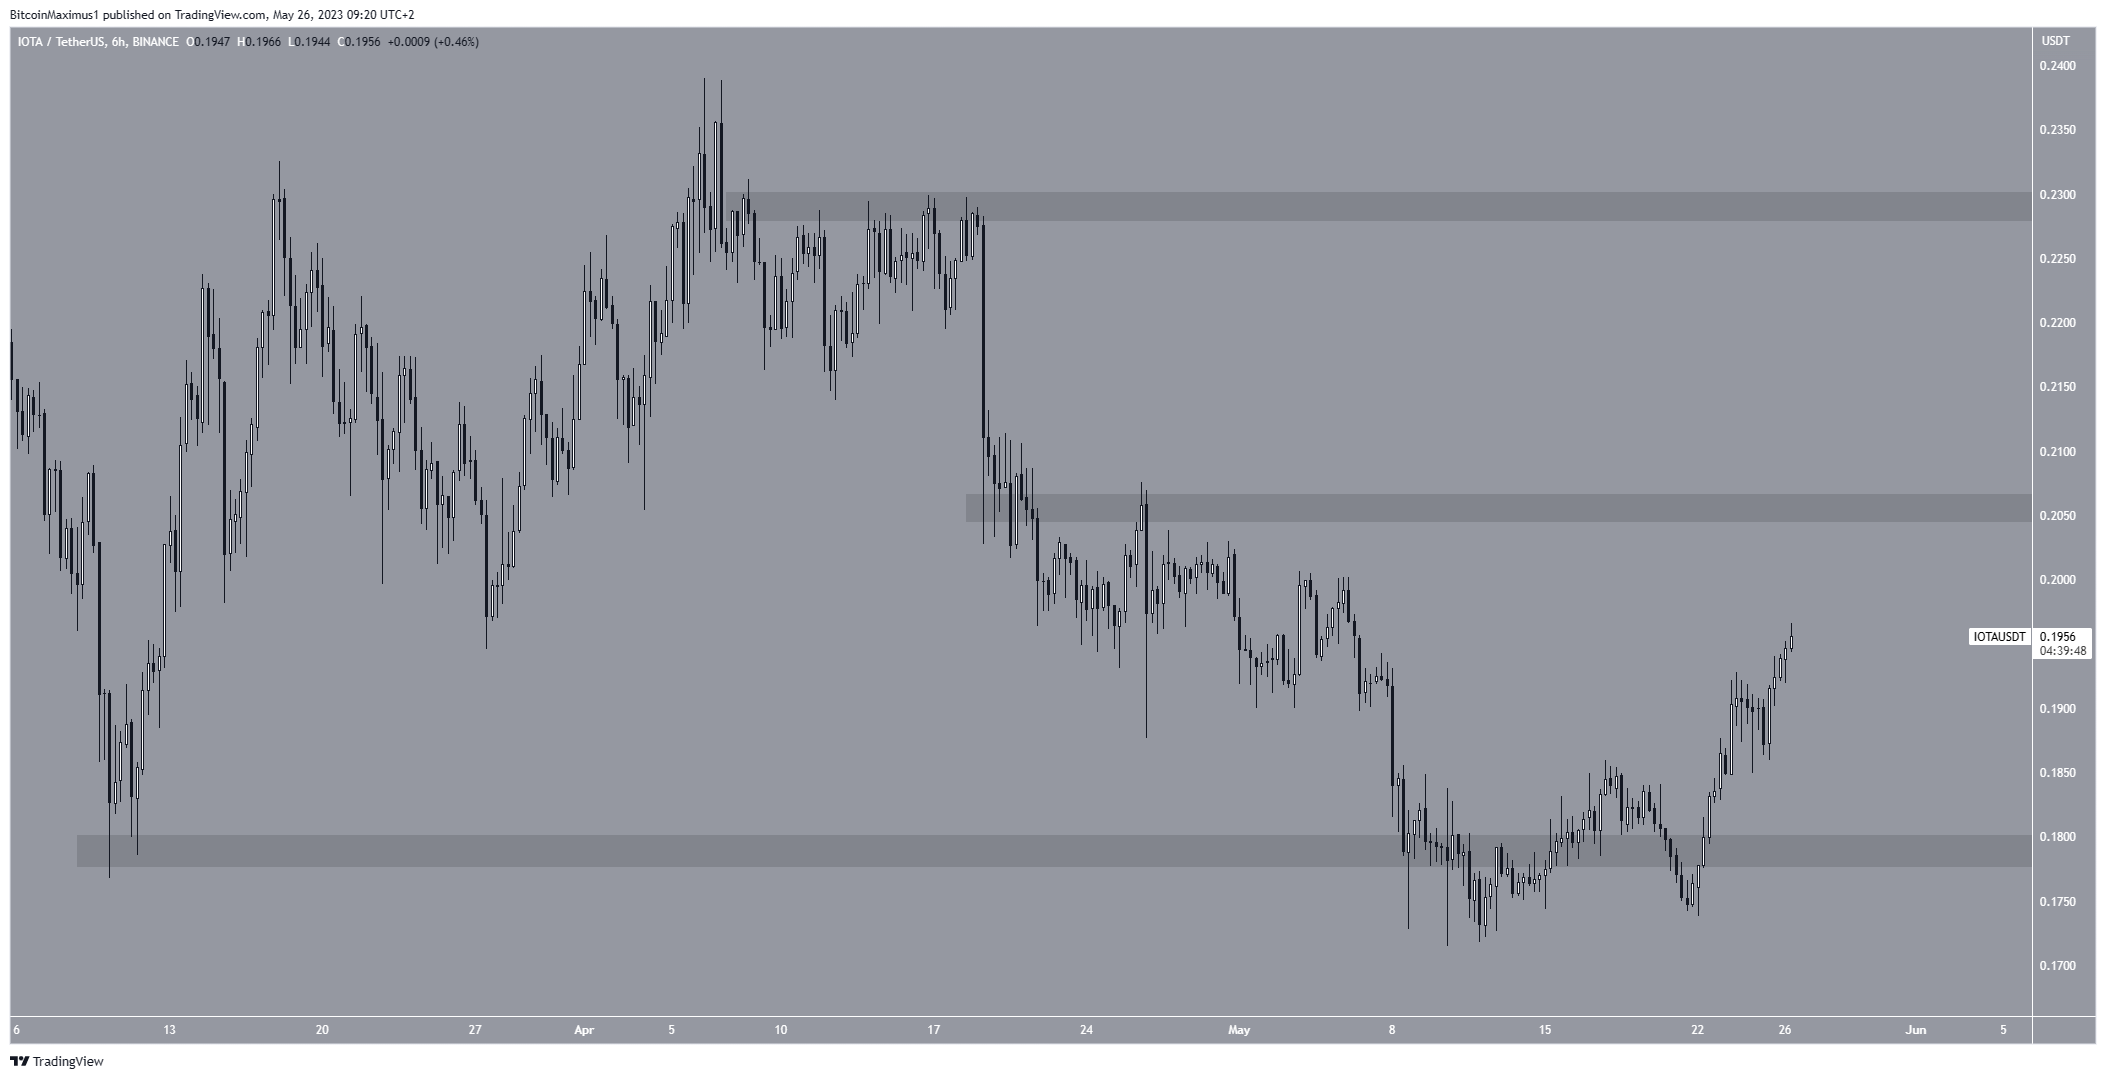
IOTA Price Marches Towards Resistance
The IOTA price has increased since May 22. The same day, it reclaimed the $0.18 horizontal area, which is now expected to provide support.
If the increase continues, the next closest resistance will be at $0.205. However, if the rally loses momentum, IOTA could drop to the $0.18 support area again.
BeInCrypto крипто рыногунун акыркы анализи үчүн бул жерди басыңыз.
баш тартуу
Ишенимдүү Долбоордун көрсөтмөлөрүнө ылайык, бул баа талдоо макаласы маалыматтык максатта гана берилген жана финансылык же инвестициялык кеңеш катары каралбашы керек. BeInCrypto так, калыс отчет берүүгө умтулат, бирок рынок шарттары эскертүүсүз өзгөрүшү мүмкүн. Ар дайым өзүңүздүн изилдөөңүздү жүргүзүп, финансылык чечимдерди кабыл алуудан мурун адис менен кеңешиңиз.
Source: https://beincrypto.com/this-weeks-top-performers-5-altcoin/