- Crypto analysts were taken by surprise with BTC’s D2TR pattern formation.
- Strejilevich expects BTC to hit $34,500 within a time frame of 65-90 days, the bulls increasing power could.
- The Bollinger bands are widening as the bulls gain power, BTC may repeat its 2019 D2TR pattern.
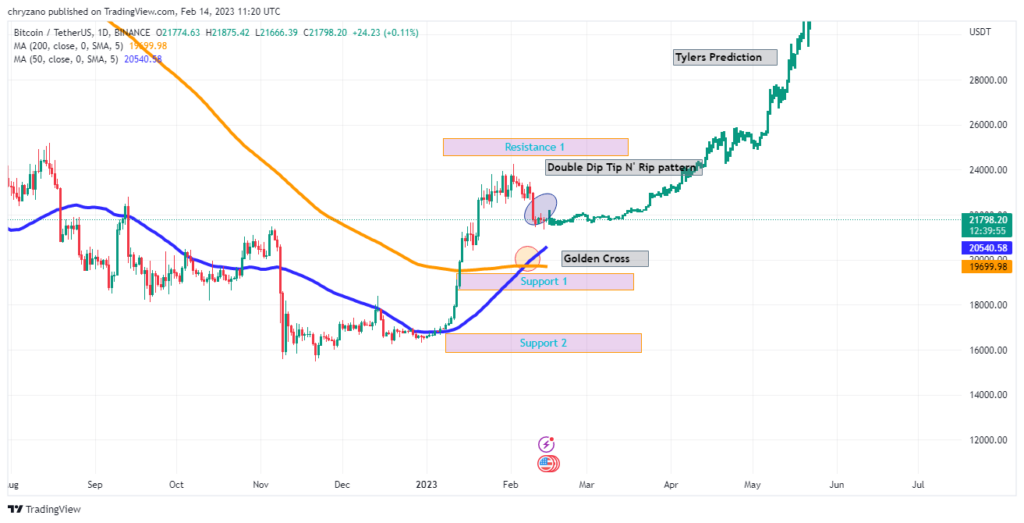
Crypto Analyst Tyler Strejilevich tweeted “ARE YOU KIDDING ME?” flabbergasted by BTC forming an identical Double Dip Tip N’ Rip pattern (D2TRP) to that of 2019. Explaining further about the minute details: consequences and the occurrence of D2TRP in particular, the analyst stated that this pattern is a multi-month reversal pattern which is mostly seen at the tail end of a macro bear market.
As per the analyst, the pattern consisted of three parts: the double dip – “vertical elevator down style dump” followed by “macro tip formation” and then the “rip”. Casting his attention to where BTC is at present, Strejilevich stated “we are on this FINAL STEP” – Rip.
Moreover, the analyst stated, “I don’t make the rules, I just follow them”. Although it is not clear why he didn’t shoulder the responsibility of his analysis, it could be assumed that he wasn’t having any allegations of shilling BTC. However, he expects BTC to hit $34,500 in the next 65-90 days.

Meanwhile, when considering the daily chart below, BTC formed the D2TR pattern just after the Golden Cross took place. The RSI on the Chart is at 47.81 and is placed parallel to the horizontal axis. The RSI reading suggests that the trend is well set and BTC could move sideways. But the occurrence of the golden cross suggests that the bulls may find the momentum to push BTC higher, higher than resistance 1.
Considering the chart below, the Bollinger bands are widening, hence, there could be more volatility in the horizon for BTC. Moreover, BTC has touched the lower Bollinger band, as such, there is a possibility that the market could correct the prices and BTC could rise. The high volatility in the market presents an opportunity for scalpers and intraday traders to leverage on.
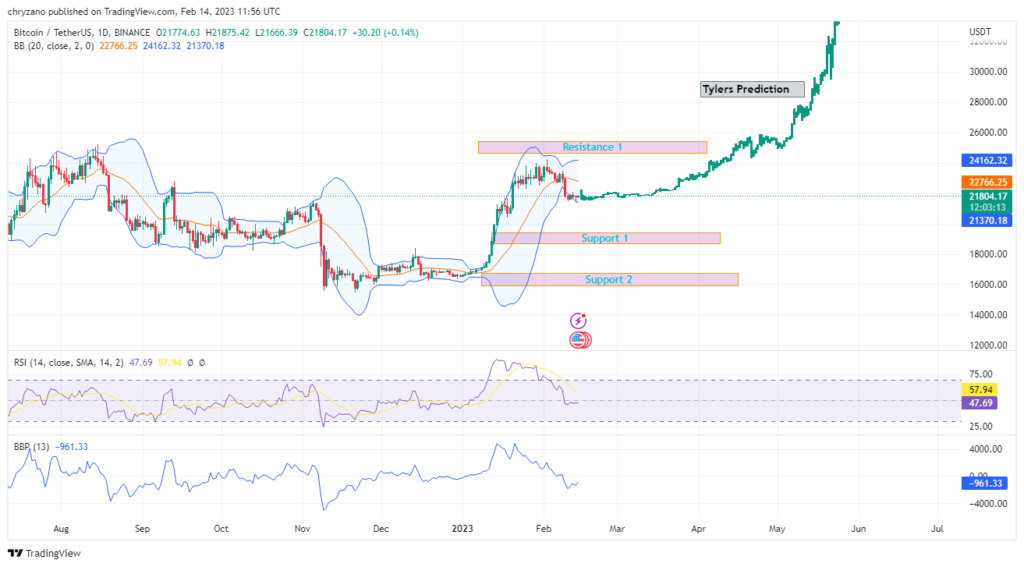
Additionally the Bull Bear Power (BBP) is at -961. However, the line is approaching the positive region, hence, it indicates that the bulls’ power is increasing. As such, there is some hope for long-position traders. However, the question is whether BTC will repeat its 2019 D2TRP. And even in the event it reciprocates this pattern, will it hit $34,500 (Strejilevich’s target) within his predicted time frame?
баш тартуу: Көз караштар жана пикирлер, ошондой эле бул баа талдоо бөлүшүлгөн бардык маалыматтар, ак ниеттүүлүк менен жарыяланган. Окурмандар өз алдынча изилдөө жана тийиштүү дыкат жасашы керек. Окурман тарабынан кабыл алынган ар кандай иш-аракеттер толугу менен өз тобокелчилигинде, Coin Edition жана анын филиалдары түз же кыйыр зыян же жоготуу үчүн жоопкерчилик тартпайт.
Source: https://coinedition.com/btcs-reciprocates-2019-double-dip-tip-n-rip-pattern-will-it-surge/