Just as Bitcoin began to show some bullish potential for a possible trend reversal, the price got rejected from the significant resistance level of $20K.
BTC is in a crucial zone, as the price action in the next few days could determine the short-term to the mid-term trend.
Техникалык анализ
менен: Эдрис
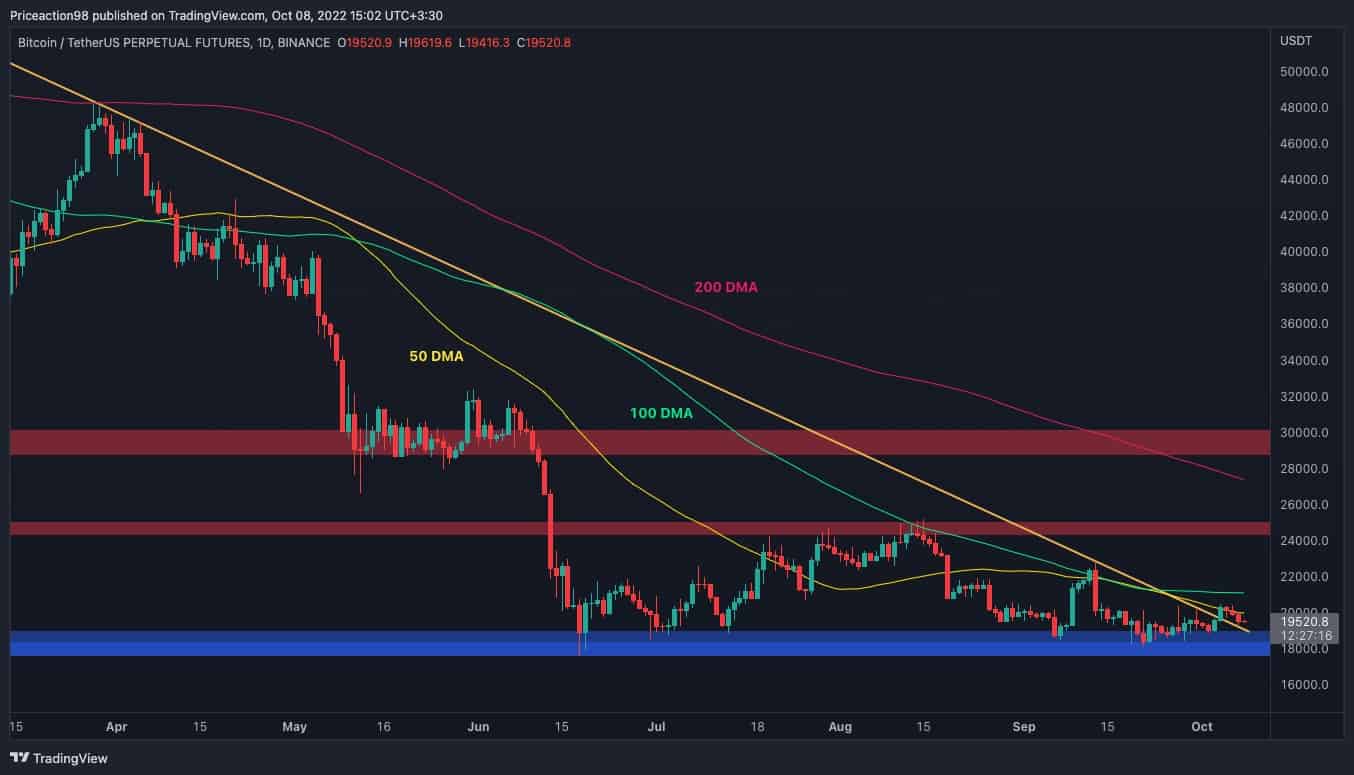
Daily Chart
The bitcoin price recently rebounded from the $18K support level and broke above the significant bearish trendline that started forming when BTC touched the $69K all-time high in November.
However, the 50-day moving average line has rejected the price, and the trendline mentioned above is being retested again, this time as support.
Suppose the trendline holds, the 100-day moving average – currently around $21K – could be the next dynamic resistance level, with the $24K mark being the major static one.
No clear bullish expectations could be made before the price breaks above the mentioned resistance levels, as the market remains bearish on the daily timeframe.
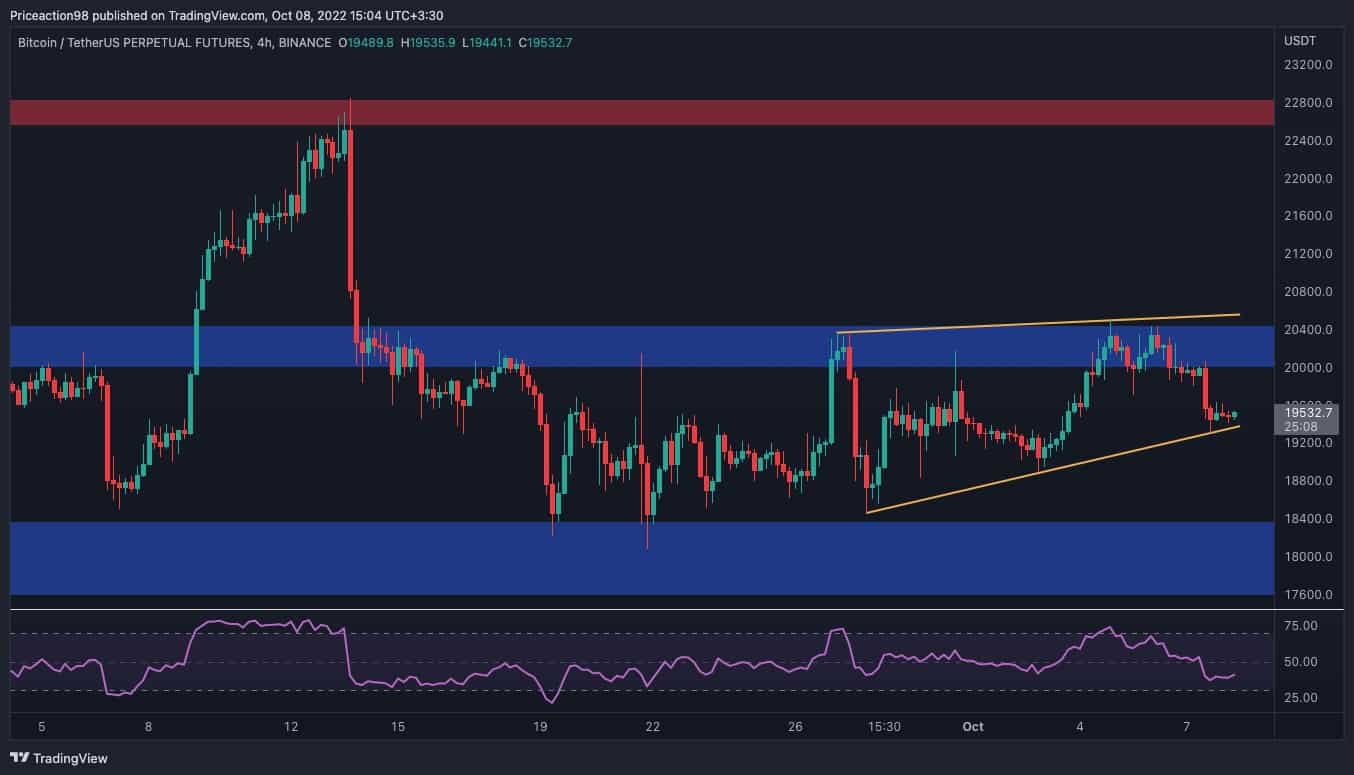
4 сааттык диаграмма
On the 4-hour timeframe, the price has yet to break out of the tight horizontal range between $18K – $20K and has been rejected to the downside one more time from the higher threshold of the range. A bearish wedge pattern has been forming in this timeframe (seen in the chart below). As of now, BTC is testing the lower boundary of the wedge.
In case of a breakdown, the market would target the $18K support level and could potentially break below and drop further. On the other hand, to invalidate the bearish wedge, the upper boundary needs to get broken to the upside. In the latter (unlikely) case, the next resistance lies at the $22,500 level.
The RSI indicator, which has signaled a potential bearish reversal while the price was testing the $20K resistance with an overbought signal, is currently hovering below 50 points, indicating that the momentum is in the bear’s favor. This also supports the bearish case.
Чынжырча талдоо
Bitcoin сарпталган чыгаруу Наркы тилкелери
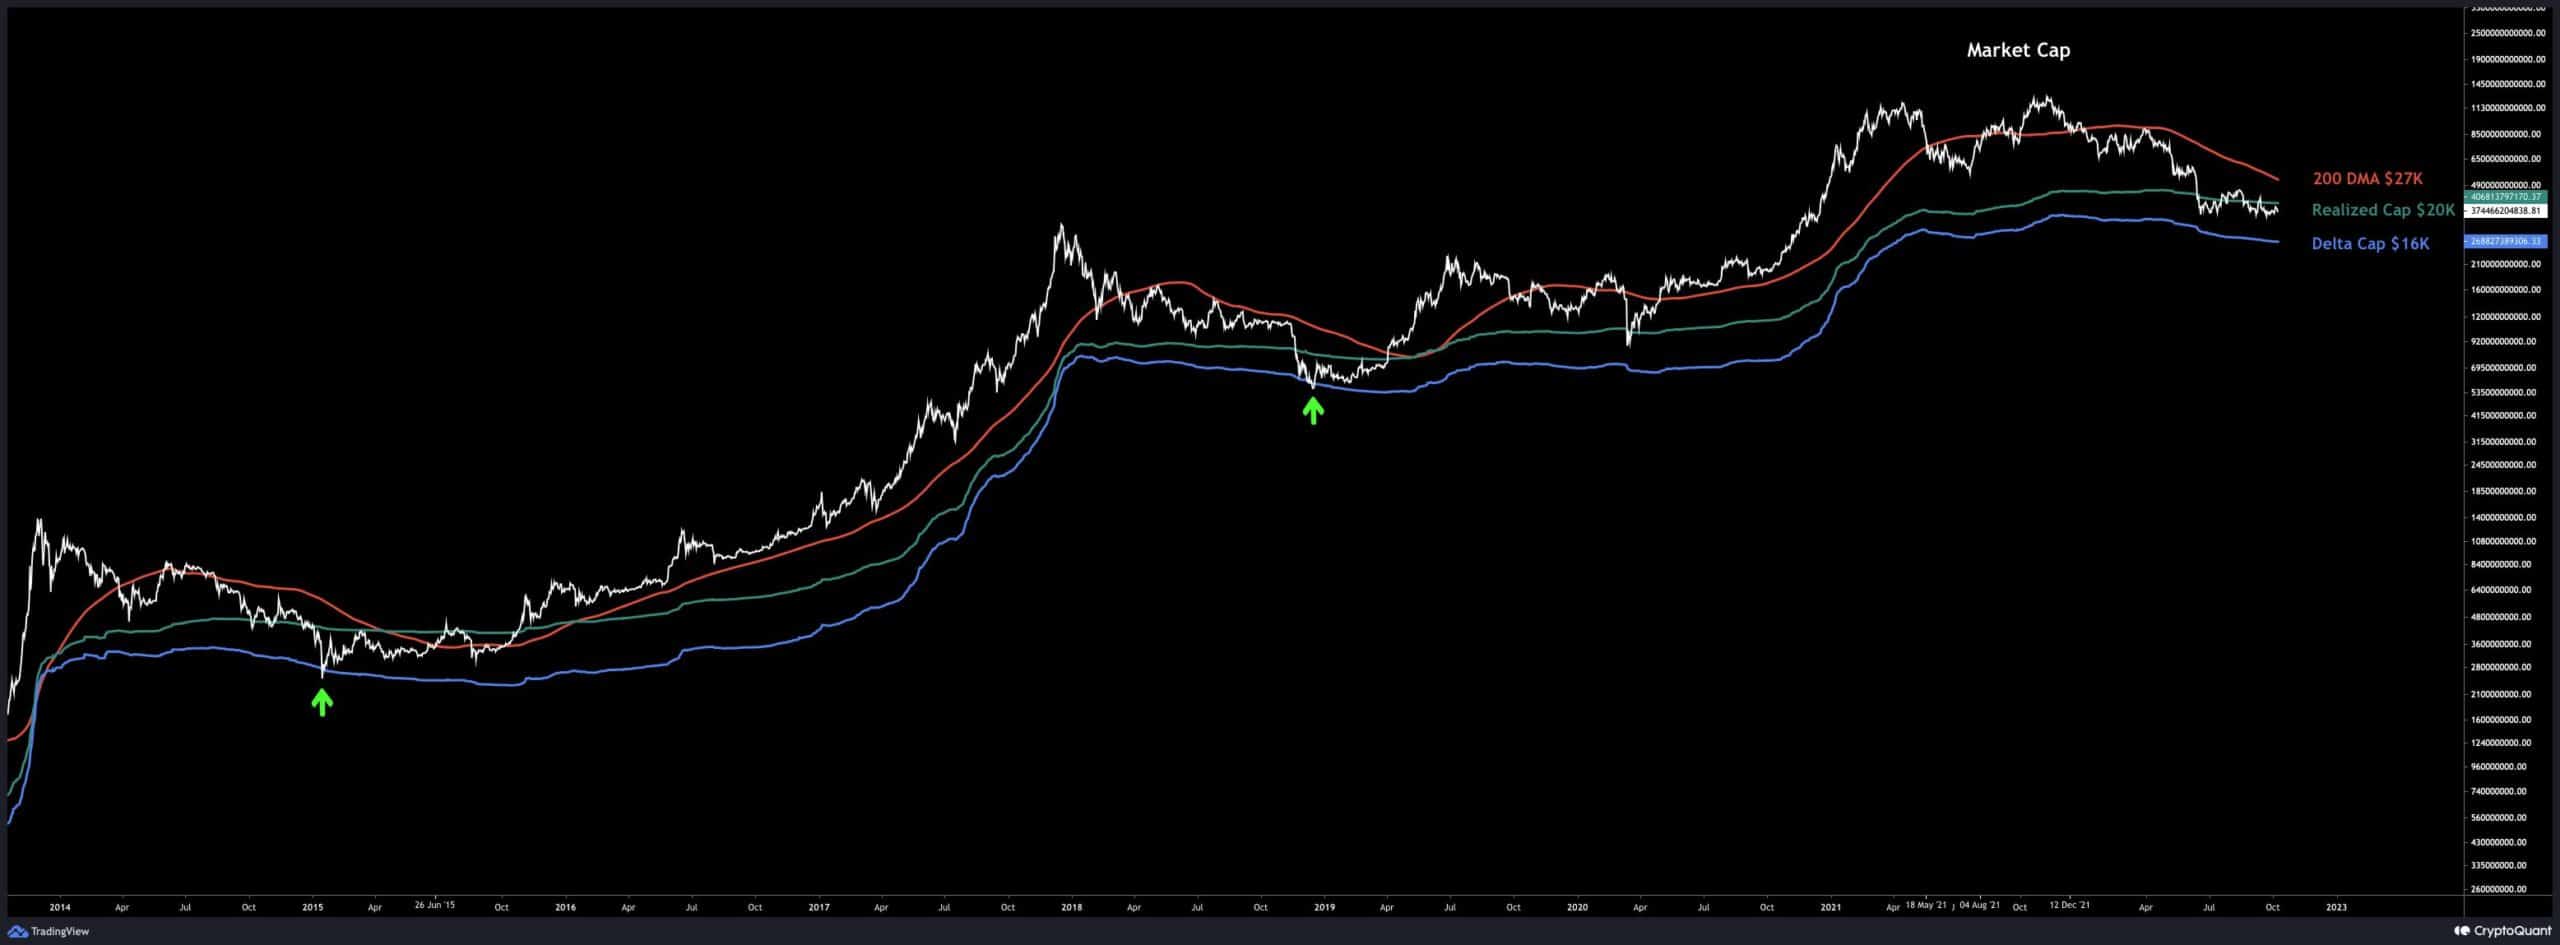
Bitcoin is still moving in a downtrend market and is yet to show promising signs of reversal, leaving market participants to wonder where the bottom is. The following chart consists of Bitcoin’s Market Cap (white) and its 200-day moving average (red), Realized Cap (green), and Delta Cap (blue).
Historically, the 200-day MA has been reliable support during bull markets and strong resistance during bear markets. Generally, areas above the 200-day moving average are considered bull market conditions, and vice versa.
The Realized Cap has also been reliable support in the first phase of previous bear markets. However, it tends to get broken to the downside for the final capitulation and when the market returns above it, a bull (or mini-bull) market begins. Finally, Delta Cap has marked the absolute bottom of the last two bear markets with great precision.
The market is currently oscillating around the realized cap located near the $20K mark, suggesting that the last phase of the bear market is underway. However, the price can still drop and test the Delta Cap, currently located around $16K, and then put in the ultimate price bottom.
It should be mentioned that this analysis is solely based on the behavior of the market during previous cycles and could fail this time. But, this chart provides a good perspective from a macro standpoint.
Binance Акысыз $100 (Эксклюзив): бул шилтемени колдонуу Каттоо жана биринчи айда Binance Futures боюнча $100 бекер жана 10% арзандатуу жыйымдарын алуу (шарттары).
PrimeXBT атайын сунушу: бул шилтемени колдонуу каттоодон өтүңүз жана депозиттериңиз боюнча 50 долларга чейин алуу үчүн POTATO7,000 кодун киргизиңиз.
Disclaimer: маалыматтар келтирилген жазуучулар ошол CryptoPotato бар табылган. Бул CryptoPotato сатып, сатуу, же кандайдыр бир салымдарды өткөрөбү же жокпу деген пикирин билдирбейт. Сиз салым чечим болбосун чыгарарда өз изилдөөлөрдү жүргүзүү сунушталат. Өз тобокелге камсыз кылган маалыматты колдонобуз. Көбүрөөк маалымат алуу үчүн тартууну карагыла.
Cryptocurrency схемалар менен TradingView.
Source: https://cryptopotato.com/bitcoin-forms-huge-bearish-wedge-is-18k-retest-incoming-btc-price-analysis/